. 2011 Jul 1;410(1):159-81.
doi: 10.1016/j.jmb.2011.04.078. Epub 2011 May 7.

Molecular dynamics simulations of viral RNA polymerases link conserved and correlated motions of functional elements to fidelity

Affiliations

Molecular dynamics simulations of viral RNA polymerases link conserved and correlated motions of functional elements to fidelity

Ibrahim M Moustafa et al. J Mol Biol. .

Abstract

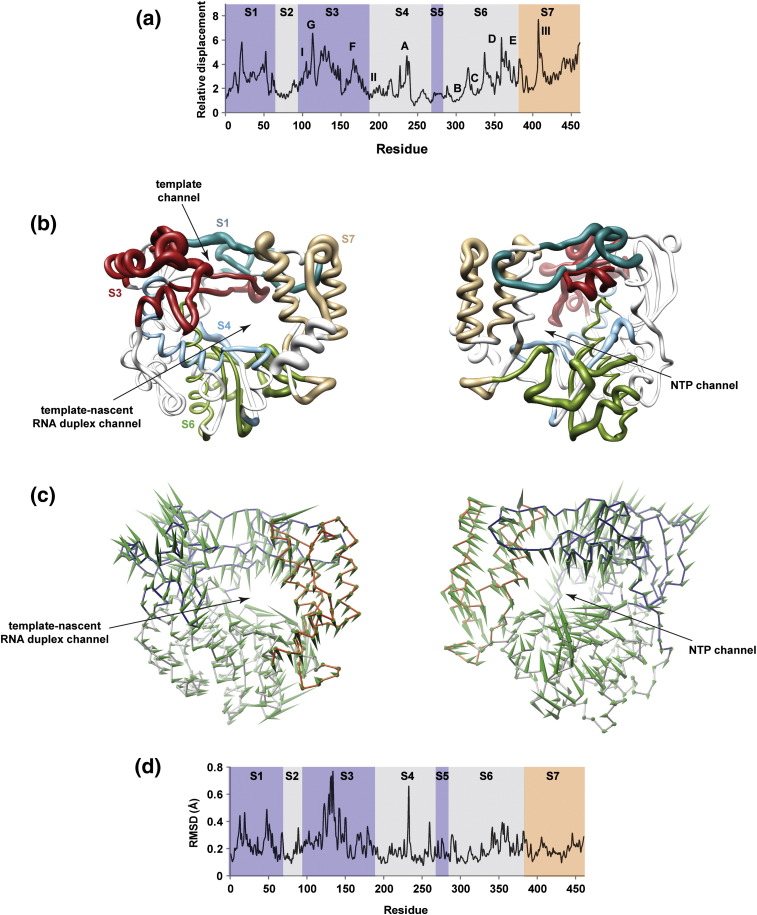
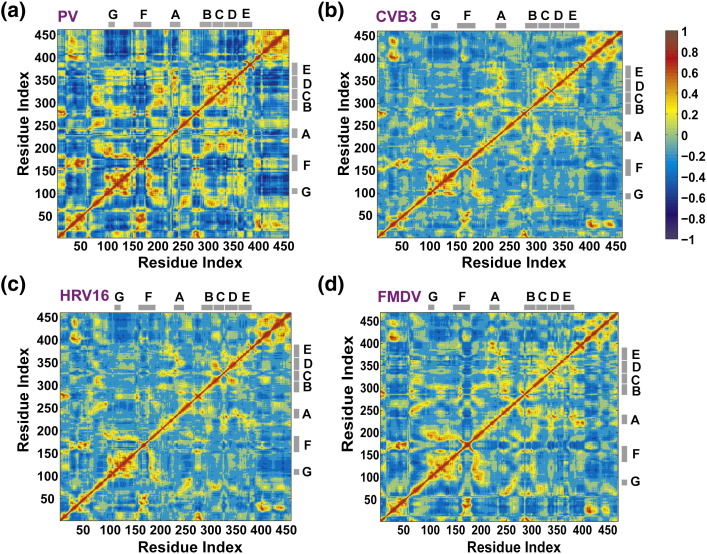
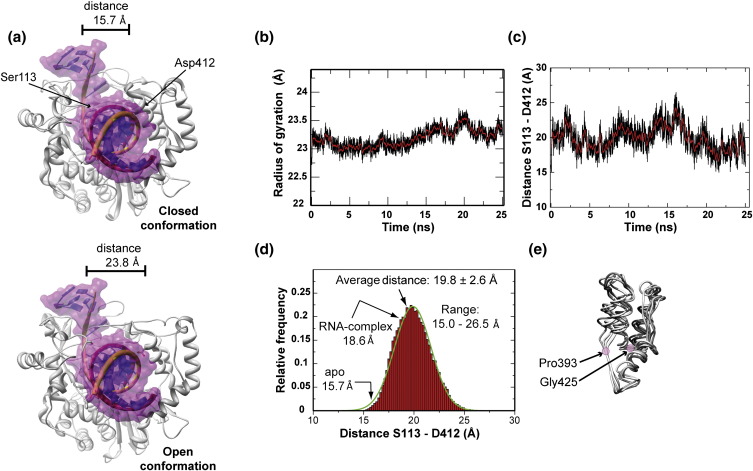
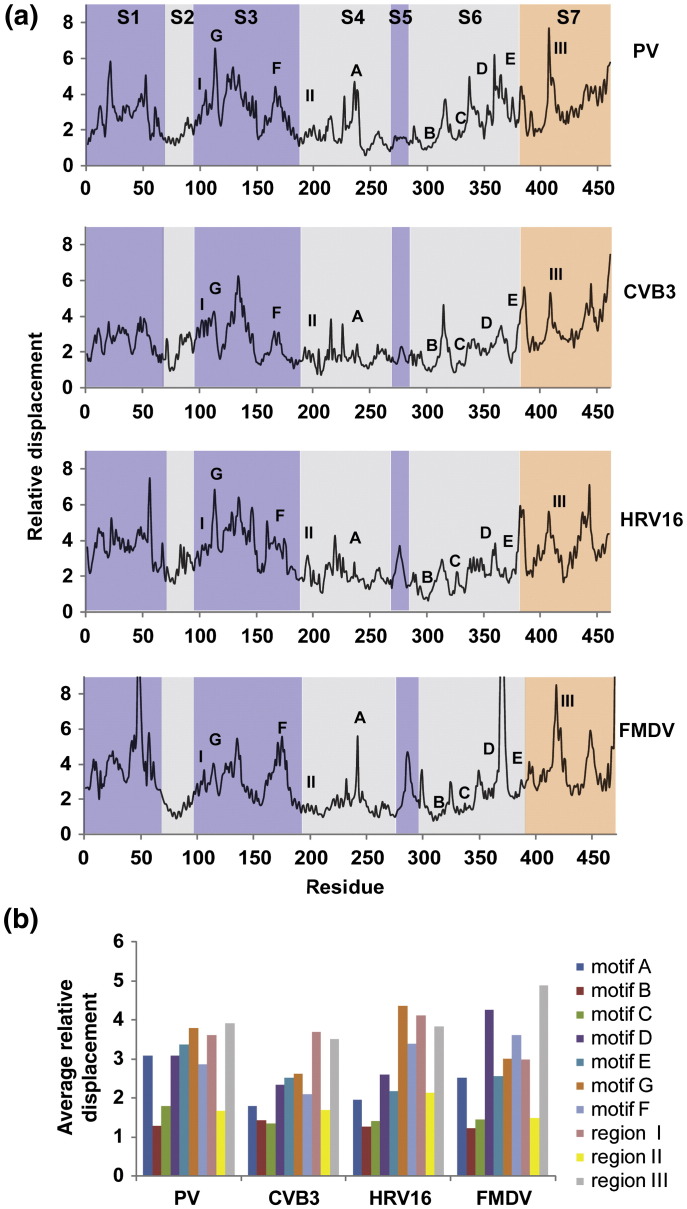
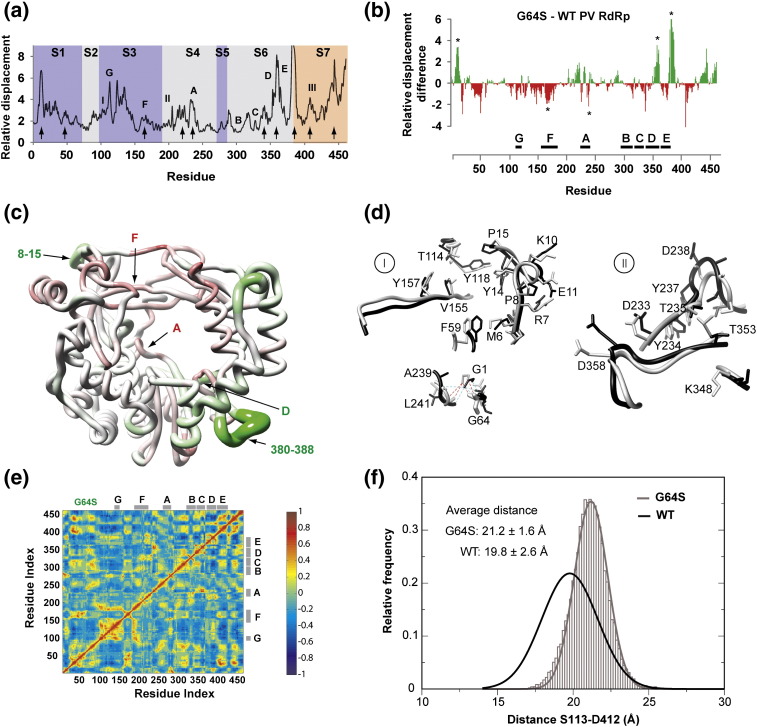
The viral RNA-dependent RNA polymerase (RdRp) is essential for multiplication of all RNA viruses. The sequence diversity of an RNA virus population contributes to its ability to infect the host. This diversity emanates from errors made by the RdRp during RNA synthesis. The physical basis for RdRp fidelity is unclear but is linked to conformational changes occurring during the nucleotide-addition cycle. To understand RdRp dynamics that might influence RdRp function, we have analyzed all-atom molecular dynamics simulations on the nanosecond timescale of four RdRps from the picornavirus family that exhibit 30-74% sequence identity. Principal component analysis showed that the major motions observed during the simulations derived from conserved structural motifs and regions of known function. The dynamics of residues participating in the same biochemical property, for example, RNA binding, nucleotide binding or catalysis, were correlated even when spatially distant on the RdRp structure. The conserved and correlated dynamics of functional structural elements suggest coevolution of dynamics with structure and function of the RdRp. Crystal structures of all picornavirus RdRps exhibit a template-nascent RNA duplex channel too small to fully accommodate duplex RNA. Simulations revealed opening and closing motions of the RNA and nucleoside triphosphate channels, which might be relevant to nucleoside triphosphate entry, inorganic pyrophosphate exit and translocation. A role for nanosecond timescale dynamics in RdRp fidelity is supported by the altered dynamics of the high-fidelity G64S derivative of PV RdRp relative to wild-type enzyme.


Figures

None
Graphical abstract
Fig. 1
Fig. 1
Structure of PV RdRp and location of conserved structural motifs. (a) The ribbon diagram shown was created from PDB code 1RA6. The three subdomains are indicated as follows: fingers (blue), palm (gray) and thumb (red). (b) The conserved structural motifs (A–G) necessary for substrate or cofactor binding and catalysis are indicated as follows: A (pink), B (yellow), C (orange), D (cyan), E (dark red), F (tan) and G (light green).
Fig. 2
Fig. 2
B-factor analysis of the PV RdRp validates MD simulation and reveals dynamic regions not seen in the crystal structure. Plots of the B-factors averaged over the protein backbone atoms calculated from simulation (top, black line) and the experimental B-factors extracted from the crystal structure (bottom, gray line) are shown. The calculated B-factors are in good agreement with those obtained from the crystal structure. However, differences were observed at some regions of the structure (marked with asterisks). Most of these differences can be attributed to crystal packing. The secondary structural elements are marked as bars at the bottom of the plots. The conserved motifs A–G are indicated by the green bars. The regions of the sequence corresponding to the different subdomains are labeled and marked with the colored bar at the top: fingers (blue), palm (gray) and thumb (red).
Fig. 3
Fig. 3
Per-residue RMSD analysis of PV RdRp suggests substantial conformational changes. The averaged per-residue RMSD was calculated using frames extracted from the last 10 ns of the trajectory at 10-ps intervals. Prior to calculation, the snapshots were superimposed onto the minimized starting structure using the backbone atoms of (a) the palm or (b) the thumb. High per-residue RMSD values for regions outside the subdomain employed for the superimposition indicate substantial conformational changes in the PV RdRp structure during simulation. In (b), segments of low per-residue RMSD values in regions other than the thumb subdomain are highlighted with short colored bars The low per-residue RMSD values suggest that residues of the highlighted regions move concertedly with residues of the thumb subdomain. (c) The residues highlighted in (b) are shown on the PV RdRp structure. These residues are involved in direct interactions with the thumb.
Fig. 4
Fig. 4
Functional motifs of PV RdRp largely contribute to the major motions observed during the simulation. (a) The relative displacements of Cα atoms observed in the sum of the first six PCs (modes) are plotted for each residue. Peaks correspond to regions contributing to the major motions observed during the MD simulations. The structure has been divided into seven segments (S1–S7). The fingers subdomain is shaded purple, the palm subdomain is shaded light gray and the thumb subdomain is shaded orange. The conserved motifs A-G are indicated. Other regions of PV RdRp known to have functional significance have been labeled I–III. (b) PV RdRp structure rendered as a tube to indicate flexibility and shown in two views: (left) looking through the template–nascent RNA duplex channel and (right) looking through the NTP channel. The radius of the tube indicates the magnitude of the relative displacement shown in (a). Each segment has a unique color. Only segments S1, S3, S4, S6 and S7 are shown. Interestingly, highly dynamic regions are located around the nascent RNA duplex and NTP channels. (c) The motion content of PC1, the largest mode of PCA, is visualized in two views that show the PV RdRp from the front (left) and the back (right). The starting structure of PV RdRp is depicted as wires with subdomains colored differently: blue (fingers), gray (palm) and red (thumb). The green “porcupine needles” indicate the direction of displacements of motions based on PC1; the size of the needle is proportional to the displacement. From the directions of displacement vectors represented by the needles, expansion and contraction of the RNA and NTP channels can be indicated; interestingly, when the template–nascent RNA duplex channel is open, the NTP channel is closed and vice versa. (d) Structural variation among multiple crystal structures of PV RdRp is represented by RMSD for each residue in PV RdRp, calculated from superimposed crystallographic structures (PDB codes 1RA6, 1RA7, 2IM0, 2IM1, 2IM2, 2IM3, 2ILY and 2ILZ). The structures were superimposed using Cα atoms of motifs B and C; superimposition was performed using Chimera. Residues that demonstrate large structural variations, indicated by high RMSD values, are implied to be flexible. Structural variations among different crystal structures qualitatively showed a pattern similar to that displayed in (a) for residues in segments S1–S5. The smaller amount of variability of residues in segment S6 could be a result of using residues within this segment for superimposition. Differences between experimental data and simulation observed for residues in segment S7 are attributable to the crystal packing effect where mobility of these residues is masked inside crystals; such an effect is absent from simulation.
Fig. 5
Fig. 5
Correlated motions in RdRps. The DCCM, which measures the correlation between the displacements of Cα atoms, calculated from simulations of RdRps from PV (a), CVB3 (b), HRV16 (c) and FMDV (d) is shown. For each enzyme, the calculated matrix whose elements are the pairwise correlation scores between its residues is visualized as a colored map. The correlation scores are encoded with a color gradient from − 1 (blue, completely anti-correlated) to + 1 (red, completely correlated). The conserved structural motifs are marked with gray bars. Residues that appeared flexible in PCA of PV RdRp (see Fig. 4a) are shown to be strongly correlated. Both positive and negative correlations have implications regarding polymerase functions as discussed in the text. The figure was prepared using MATLAB 7.6.
Fig. 6
Fig. 6
Opening and closing of the RNA-binding channel of PV RdRp. (a) The closed (top) and open (bottom) conformations of PV RdRp with modeled RNA. The RNA modeled in the apoenzyme representing the closed conformation was taken from the PV RdRp elongation complex structure (PDB code 3OL6). The open conformation derives from a snapshot from the simulation. (b) Oscillation of the radius of gyration (Rg). The time evolution of Rg for the simulated structure is shown by the black line; the running average (200-ps window) is shown by the red line. (c) Oscillation of the Cα–Cα distance of Ser113 (fingers) and Asp412 (thumb). The time evolution of distance for the simulated structure is shown by the black line; the running average (200-ps window) is shown by the red line. (d) The frequency distribution of the distances observed in (c). The green line represents the fit to a Gaussian model using the program Grace-5.1.22. (e) Hinge-twist motion of the thumb observed by superimposition of snapshots across the simulation trajectory. Residues P393 and G425 are the pivot points for the motion.
Fig. 7
Fig. 7
Conserved dynamics of the RdRps from PV, CVB3, HRV16 and FMDV. (a) The relative displacements of Cα atoms observed in the sum of the first six PCs (modes) are plotted for each residue. Peaks correspond to regions contributing to the major motions observed during the MD simulations. The structure has been divided into seven segments (S1–S7). The fingers subdomain is shaded purple, the palm subdomain is shaded light gray and the thumb subdomain is shaded orange. The conserved motifs A–G are indicated. Other regions of PV RdRp known to have functional significance have been labeled I–III. Dynamic regions under the peaks across the different polymerases show a striking similarity; the observed dynamic patterns are largely conserved. The major peaks in the different segments (S1–S7) observed in PV are also observed at equivalent positions for the other three RdRps. Nonetheless, differences in relative displacements of motifs A and E as well as of the region spanning residues 43–55 in the fingers are noted. Local sequence and structural variations might account for the differences in the observed dynamics. The plot of PV RdRp, shown previously in Fig. 4, is included for comparison with the other RdRps. (b) The average relative displacement calculated for the conserved motifs A–G and functional regions I–III of each RdRp is shown. The average was calculated by using the relative displacement of all residues constituting the motif as defined in Table S1.
Fig. 8
Fig. 8
Global changes in the dynamics of PV RdRp anti-mutator (G64S 3Dpol). (a) The relative displacements of Cα atoms observed in the sum of the first six PCs (modes) are plotted for each residue. Regions showing visually observable differences of the relative displacement between G64S and WT are indicated by arrows. (b) The differences between relative displacements of WT and G64S are shown. Positive differences (green bars) indicate regions in G64S that are more flexible than WT, negative differences (red bars) indicate less flexible regions. (c) Mapping of the differences between G64S and WT onto the structure of the WT PV RdRp. The differences are shown as color gradients of green (positive) and red (negative); the structure is rendered as a tube whose radius indicates the magnitude of the difference (large radius corresponds to regions that are more flexible in G64S, and small radius corresponds to regions that are less flexible compared to WT). (d) Structural perturbations caused by the G64S substitution. The average structures for WT (black) and G64S (gray) are shown. (d-I) shows changes from position 64 to the N-terminal residues (8–15) and motif F (162–172). (d-II) shows changes in motif D (353–362). The hydrogen-bonding network involving residues Gly1, Gly64, A239 and Leu241 remains in both enzymes. (e) The DCCM calculated for G64S PV RdRp as done for the WT enzymes in Fig. 5. (f) Opening and closing of the template–nascent RNA duplex channel. The frequency distribution for the Cα–Cα distance of Ser113 (fingers) and Asp412 (thumb) in G64S (gray curve) is shown. The black curve corresponds to the WT and is shown for comparison. A shift to the more open conformations is observed in G64S relative to the WT.

References

    1. World Health Organization. (2008). Laboratory surveillance for wild and vaccine-derived polioviruses, January 2007–June 2008. Wkly. Epidemiol. Rec.83, 321–328. - PubMed
    1. Jegouic S., Joffret M.L., Blanchard C., Riquet F.B., Perret C., Pelletier I. Recombination between polioviruses and co-circulating Coxsackie A viruses: role in the emergence of pathogenic vaccine-derived polioviruses. PLoS Pathog. 2009;5:e1000412. - PMC - PubMed
    1. De Clercq E. The design of drugs for HIV and HCV. Nat. Rev., Drug. Discov. 2007;6:1001–1018. - PubMed
    1. Graci J.D., Cameron C.E. Therapeutically targeting RNA viruses via lethal mutagenesis. Future Virol. 2008;3:553–566. - PMC - PubMed
    1. Graci J.D., Cameron C.E. Challenges for the development of ribonucleoside analogues as inducers of error catastrophe. Antiviral Chem. Chemother. 2004;15:1–13. - PubMed

Publication types

MeSH terms