. 2011 May 17;19(5):613-28.
doi: 10.1016/j.ccr.2011.03.012.

Defective regulation of autophagy upon leucine deprivation reveals a targetable liability of human melanoma cells in vitro and in vivo

Affiliations

Defective regulation of autophagy upon leucine deprivation reveals a targetable liability of human melanoma cells in vitro and in vivo

Joon-Ho Sheen et al. Cancer Cell. .

Abstract

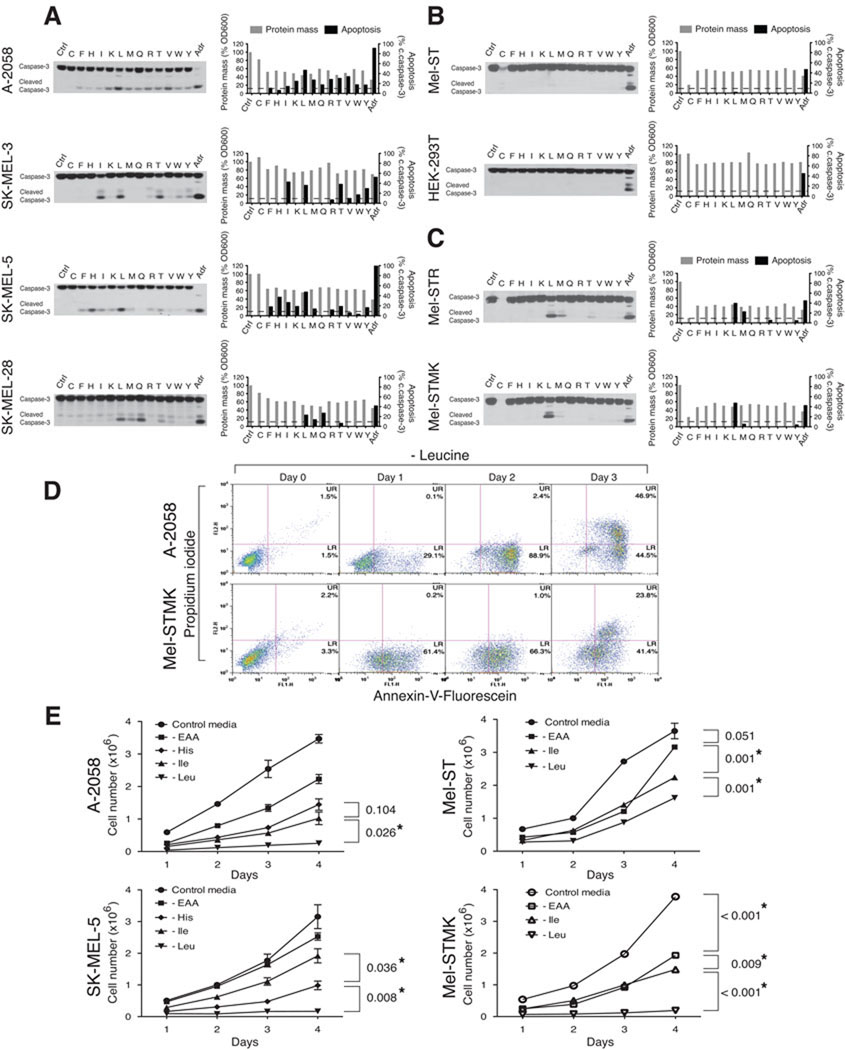
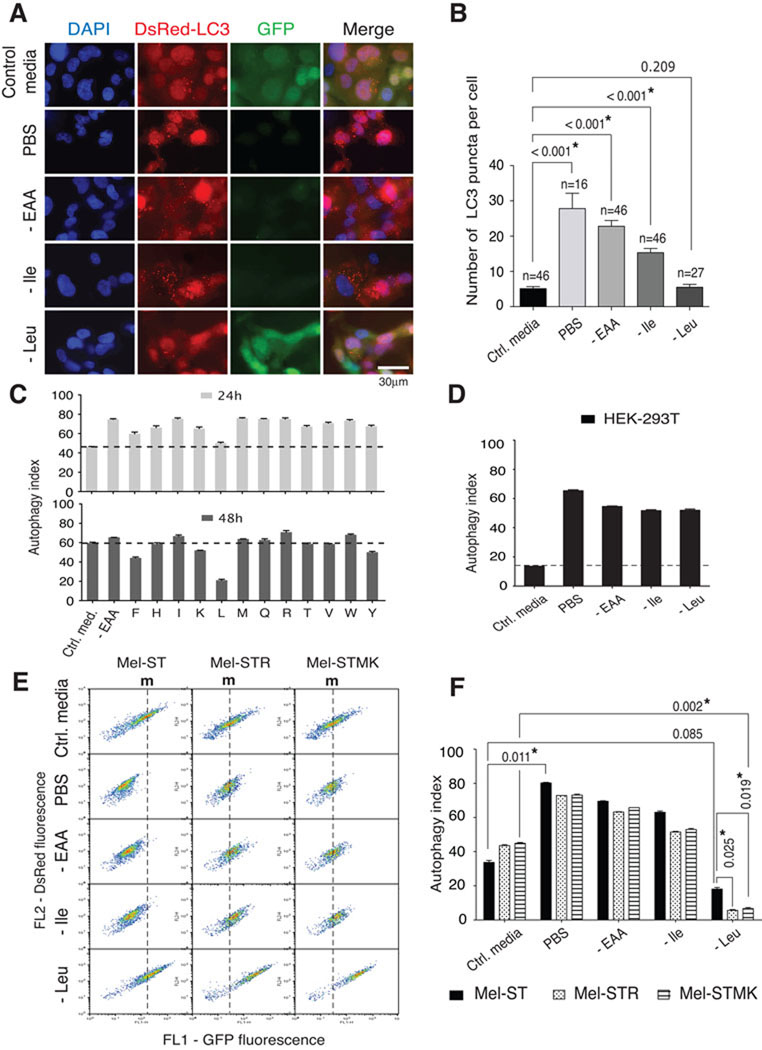
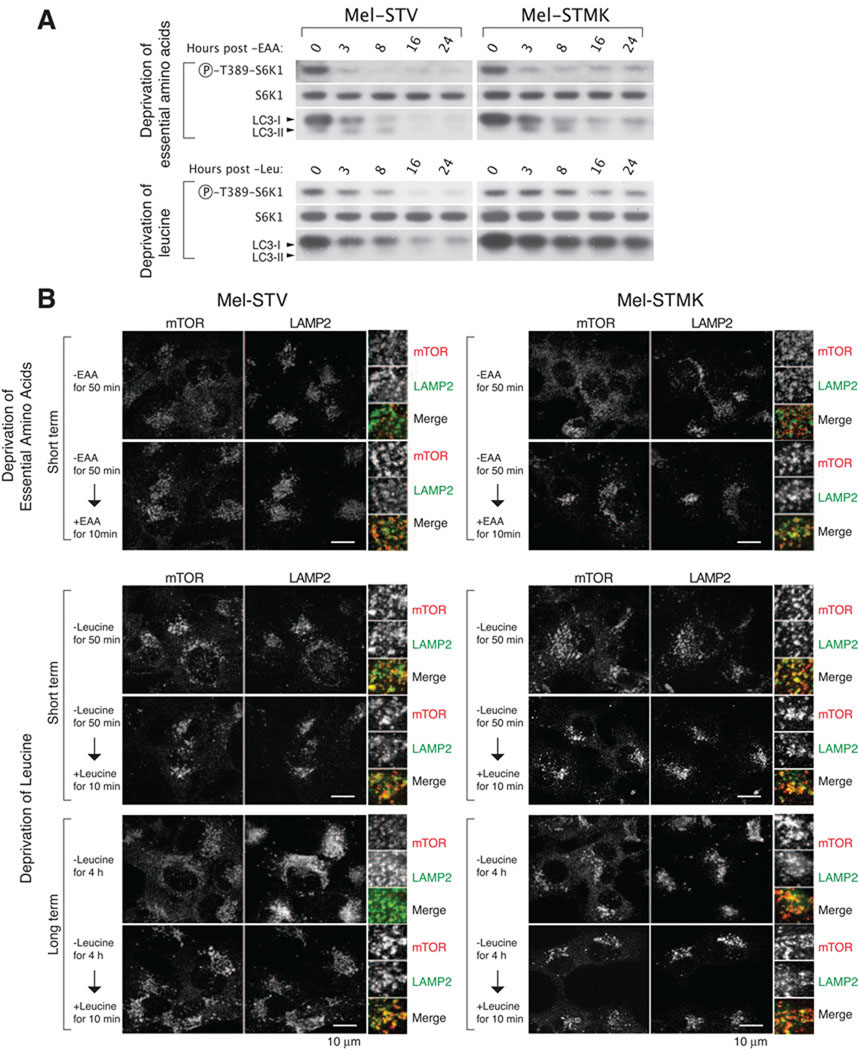
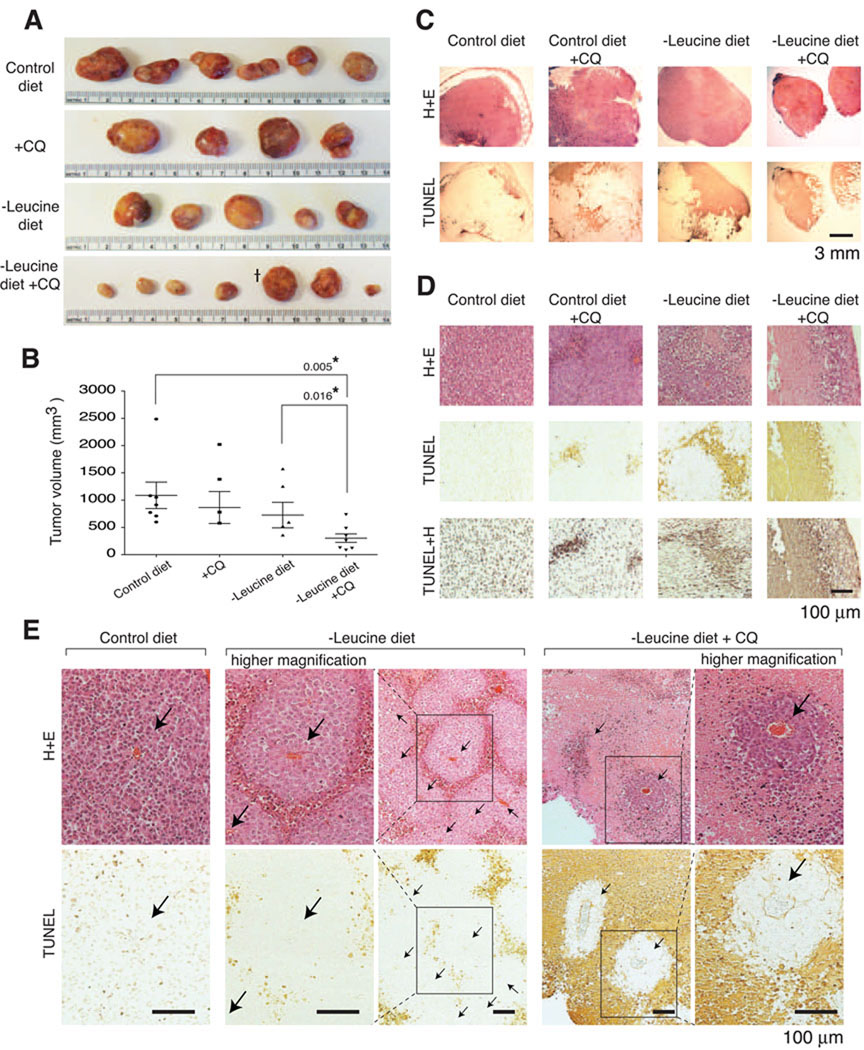
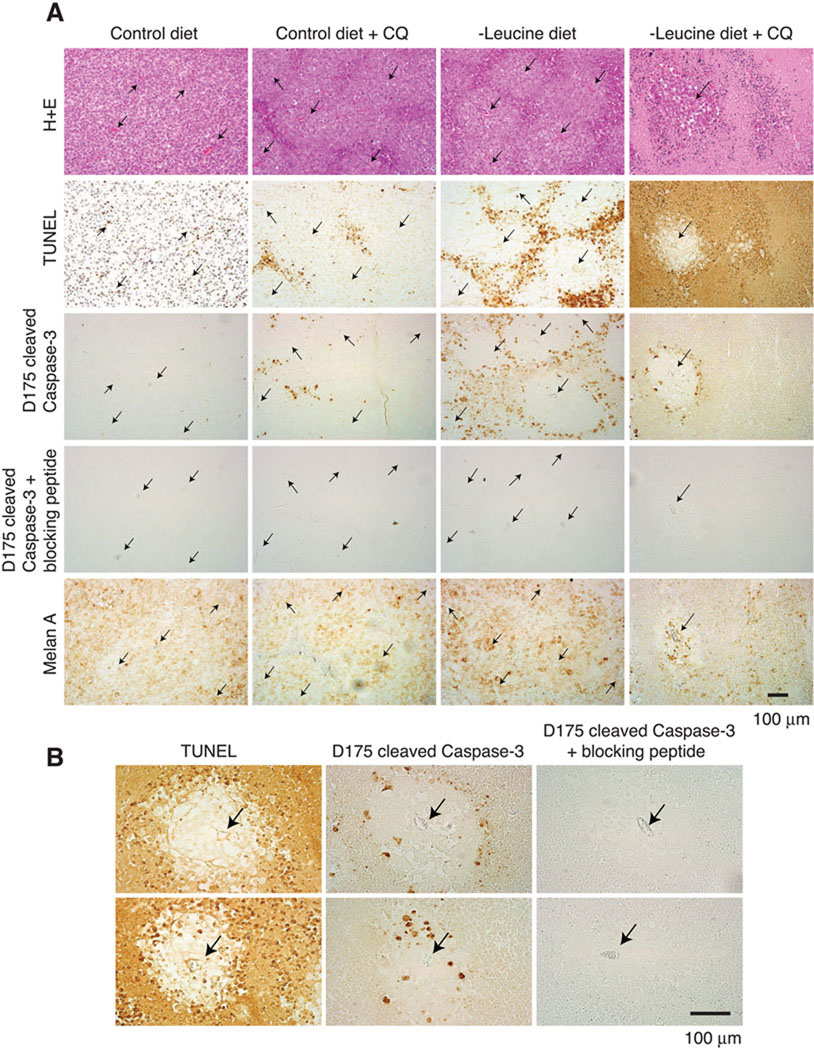
Autophagy is of increasing interest as a target for cancer therapy. We find that leucine deprivation causes the caspase-dependent apoptotic death of melanoma cells because it fails to appropriately activate autophagy. Hyperactivation of the RAS-MEK pathway, which is common in melanoma, prevents leucine deprivation from inhibiting mTORC1, the main repressor of autophagy under nutrient-rich conditions. In an in vivo tumor xenograft model, the combination of a leucine-free diet and an autophagy inhibitor synergistically suppresses the growth of human melanoma tumors and triggers widespread apoptosis of the cancer cells. Together, our study represents proof of principle that anticancer effects can be obtained with a combination of autophagy inhibition and strategies to deprive tumors of leucine.


Figures

Figure 1
Figure 1. Leucine deprivation induces apoptosis in human melanoma cells
Survey of patient derived melanoma cells (A), immortalized human melanocytes and the non-melanocyte-derived line (B), and transformed melanocytes (C). Immunoblot analyses for intact and cleaved caspase-3 of indicated cell lines following a 48 hr deprivation for individual essential amino acids. Bar graphs indicate relative changes in protein mass (a readout for cell growth and proliferation) and percent activation of caspase-3 (ratio of cleaved to full-length caspase-3). Dotted lines indicate 10% activation of caspase-3. Ctrl, control RPMI-1640 media; C-F-H-I-K-L-M-Q-R-T-V-W-Y, deprivation of the indicated single amino acid (single-letter code for amino acid); Adr, adriamycin at 2 µg/ml. (D) Annexin-V assay for apoptosis induction. FL1; Annexin-V-Fluorescein, FL2; Propidium Iodide, UR; upper right quadrant, LR; lower right quadrant. (E) Cell survival assay. Cells were deprived of all essential amino acids (-EAA), histidine (-His), isoleucine (-Ile), or leucine (-Leu) for 2 days and re-seeded into control RPMI-1640 media, and changes in cell number were measured at indicated time points. Data are represented as mean ± s.d. and * indicates values that are significantly different from controls. See also Figure S1.
Figure 2
Figure 2. Activation of caspase cascade through the mitochondrial apoptotic pathway is necessary for leucine deprivation-induced death
(A) Micrographs showing morphological changes following deprivations of all essential amino acids (-EAA), isoleucine, or leucine in the presence or absence of 20 µM Q-VD-OPH. Scale bar = 100 µm. (B) Immunoblot analyses showing the dose-dependent inhibitory effect of increasing concentrations of Q-VD-OPH (0 µM, 5 µM, 20 µM, and 100 µM) on caspase mediated processes. (C) Cell survival assay. Cells were deprived of leucine (-Leu) for 2 days in the presence or absence of pan-caspase inhibitors, 20 µM Q-VD-OPH or 100 µM Z-VAD-fmk. (D) Flow cytometric analyses showing changes in MOMP using JC-1 dye. FL1; J-monomer (JC-1 green fluorescence), FL2; J-aggregates (JC-1 red fluorescence). (E) Immunoblot analyses show the effect of Bcl-xL expression on caspase-3 activation upon leucine deprivation. (F) Flow cytometric analyses showing changes in MOMP. (G) Cell survival assay. Data are represented as mean ± s.d. and * indicates values that are significantly different from controls.
Figure 3
Figure 3. Deprivation of leucine does not activate autophagy in melanoma cells with activated Ras-MEK signaling
(A) Fluorescent micrographs showing autophagy markers. Control, complete RPMI-1640 media control; PBS, phosphate buffered saline; -EAA, deprivation of all essential amino acids, -Ile, deprivation of isoleucine; -Leu, deprivation of leucine. DAPI, cell nuclei; DsRed-LC3, red fluorescence from DsRed-LC3 puncta; GFP, green fluorescence from the uncleaved DsRed-LC3-GFP reporter; Merge, merged image of DAPI, DsRed, and GFP signals. (B) Quantitation of DsRed-LC3 puncta. Bar graphs display the mean ± s.d. of DsRed-LC3 puncta per cell following each type of nutrient starvation. The numbers of cells examined are indicated. (C) Flow cytometric analyses of autophagic activity. The bar graphs show mean ± s.d. of autophagy indexes obtained after deprivation of single essential amino acids for 24 or 48 hours (n = 3). Dotted lines indicate the autophagy index of cells incubated in control media. (D) Autophagy index in HEK-293T cells following PBS incubation or indicated amino acid deprivations. (E) Flow cytometric quantitation of the autophagy activity. m, marks line indicating median fluorescence intensity of FL1 (GFP fluorescence) in cells in the control media. (F) Bar graphs show mean ± s.d. of the autophagy index (n = 3) and * indicates values that are significantly different from controls. See also Figure S2.
Figure 4
Figure 4. Deregulated activation of the mTORC1 pathway by constitutively active MEK correlates with the inappropriate localization of mTOR to the lysosomal surface
(A) Immunoblot analyses showing time-dependent changes in mTORC1 and autophagy activity in indicated cell types following deprivation for all essential amino acids or leucine. (B) Immunofluorescence analyses showing mTOR localization upon the deprivation of all essential amino acids (-EAA) or leucine (-Leu). Cells were deprived of indicated amino acids for short (50 minutes) or long (4 hours) periods of time, and re-fed with the amino acids for 10 minutes before processing for co-immunostaining for mTOR (red) and LAMP2 (green), and imaging. In all images, insets show selected fields that were magnified five times and their overlay. Scale bar = 10 µm. See also Figure S3.
Figure 5
Figure 5. The inhibition of autophagy synergizes with low leucine concentrations in inducing apoptosis in melanoma cells
(A) Bar graphs displaying the autophagy index in the presence or absence of rapamycin (RAPA) or U-0126. (B–E) Immunoblot analyses for cleavage and activation of caspase-3 and cleavage of PARP. (F–H) Cell survival assay. (I) Immunoblot analyses showing validation of shRNA-mediated knockdowns of ATG1. (J) Knockdown of ATG1 mimics effects of expressing Ras-G12V or MEK1-Q56P in sensitizing Mel-ST cells to caspase-3 activation upon leucine deprivation. (K) Immunoblots show cleavage of caspase-3 and PARP in cells incubated with decreasing amounts of leucine in the presence or absence of chloroquine. (L) Chloroquine (CQ) sensitizes A-2058 melanoma cells to partial leucine deprivation. Immunoblots show and graph quantitates activation of caspase-3 in relation to leucine concentration in media with or without chloroquine. (M) Percent survival of A-2058 cells cultured under indicated conditions for 2 days. Data are represented as mean ± s.d. and * indicates values that are significantly different from controls. See also Figure S4.
Figure 6
Figure 6. Synergistic inhibition of melanoma tumor growth in mice deprived of dietary leucine and treated with an autophagy inhibitor
(A) Photographs of excised tumor xenografts following feeding for 14 days with an isocaloric control diet with added leucine (Control diet), control diet plus chloroquine (+CQ), leucine-free diet (-Leucine diet), or leucine-free diet plus chloroquine (-Leucine diet +CQ). (B) Column scatter dot graph displays the mean ± s.e.m. volume of the tumors. * indicates volumes that are significantly different from controls. Note: tumor that is third from the right in the − Leucine diet + CQ group had a flattened disc shape rather than the spherical shape of the large tumors obtained in the other groups. Thus, it appears deceptively large in the photograph. (C) In situ TUNEL assay. H+E, representative micrograph images of tumor sections stained with hematoxylin and eosin; TUNEL, representative images of tumor sections processed in the TUNEL assay; TUNEL+H, representative images of TUNEL results counterstained with hematoxylin. Scale bar = 3 mm. (D) Representative high magnification micrographs of tumor sections showing TUNEL-positive, apoptotic regions. Scale bar = 100 µm. (E) Apoptosis of the melanoma cells inside tumors correlates with the distance from tumor capillaries, and inhibition of autophagy significantly shrinks the viable cuffs surrounding tumor capillaries. Micrographs show corresponding high and low magnification images of tumor sections with capillaries indicated (with arrows) and TUNEL-positive, apoptotic regions. Scale bar =100 µm.
Figure 7
Figure 7. Combination of dietary leucine deprivation and autophagy inhibition induces activation of caspase-3 in melanoma tumors in vivo
(A) Immunohistochemical analyses showing caspase-3 cleavage in vivo. H+E, images of tumor sections stained with hematoxylin and eosin where capillaries are denoted with arrows; TUNEL, images of tumor sections processed for the TUNEL assay; D175 cleaved Caspase-3, images of tumor sections stained for active caspase-3 with the anti-Asp-175 site-specific cleaved caspase-3 antibody; D175 cleaved Caspase-3 + blocking peptide, images of tumor sections stained for active caspase-3 with the anti-Asp-175 site-specific cleaved caspase-3 antibody that was pre-incubated with the epitope blocking peptide; Melan A, images of tumor sections stained with anti-Melan A, a human melanocyte specific marker, antibodies. Scale bar = 100 µm. (B) Representative high magnification micrographs of tumor tissues showing geographic correlation between the TUNEL-positive signals and the D175 cleaved caspase-3 positive signals where capillaries are denoted with arrows. Scale bar =100 µm. See also Figure S5.

Comment in

References

    1. Alao JP. The regulation of cyclin D1 degradation: roles in cancer development and the potential for therapeutic invention. Mol Cancer. 2007;6:24. - PMC - PubMed
    1. Amaravadi RK, Yu D, Lum JJ, Bui T, Christophorou MA, Evan GI, Thomas-Tikhonenko A, Thompson CB. Autophagy inhibition enhances therapy-induced apoptosis in a Myc-induced model of lymphoma. J Clin Invest. 2007;117:326–336. - PMC - PubMed
    1. Anthony TG, McDaniel BJ, Byerley RL, McGrath BC, Cavener DR, McNurlan MA, Wek RC. Preservation of liver protein synthesis during dietary leucine deprivation occurs at the expense of skeletal muscle mass in mice deleted for eIF2 kinase GCN2. J Biol Chem. 2004;279:36553–36561. - PubMed
    1. Bamford S, Dawson E, Forbes S, Clements J, Pettett R, Dogan A, Flanagan A, Teague J, Futreal PA, Stratton MR, Wooster R. The COSMIC (Catalogue of Somatic Mutations in Cancer) database and website. Br J Cancer. 2004;91:355–358. - PMC - PubMed
    1. Berg JM, Tymoczko JL, Stryer L. Biochemistry. 6th ed. W.H.Freeman and Company; 2007.

Publication types

MeSH terms