. 2011 Aug;39(15):6475-88.
doi: 10.1093/nar/gkr343. Epub 2011 May 16.

Tracking epigenetic histone modifications in single cells using Fab-based live endogenous modification labeling

Affiliations

Tracking epigenetic histone modifications in single cells using Fab-based live endogenous modification labeling

Yoko Hayashi-Takanaka et al. Nucleic Acids Res. 2011 Aug.

Abstract

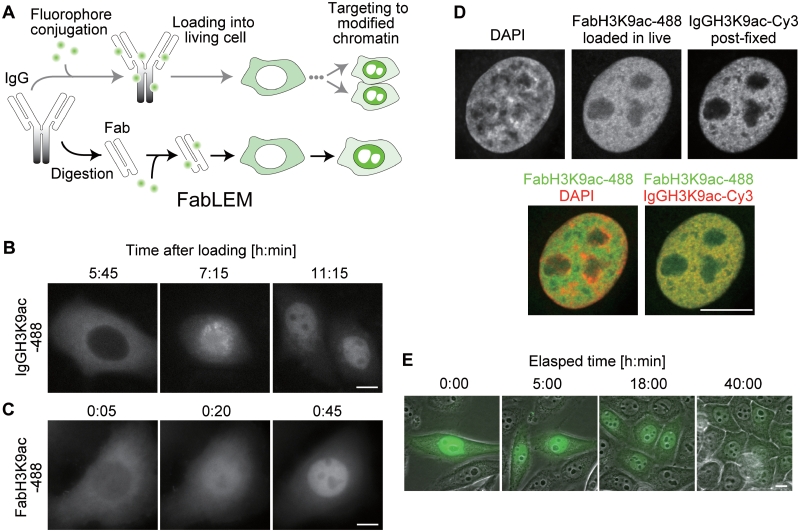
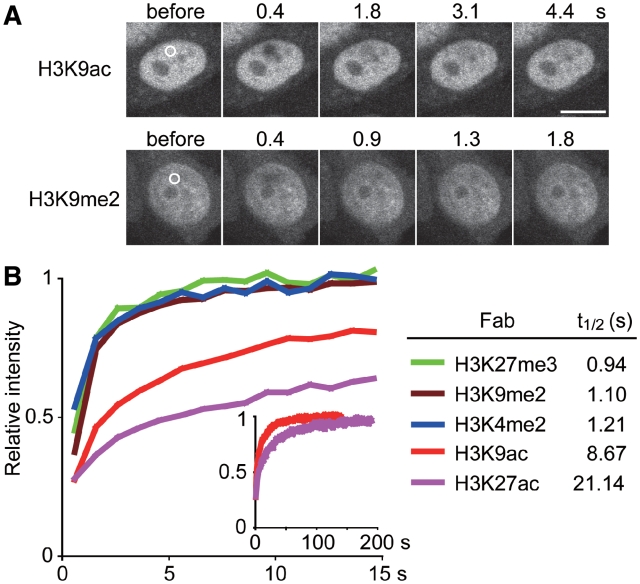
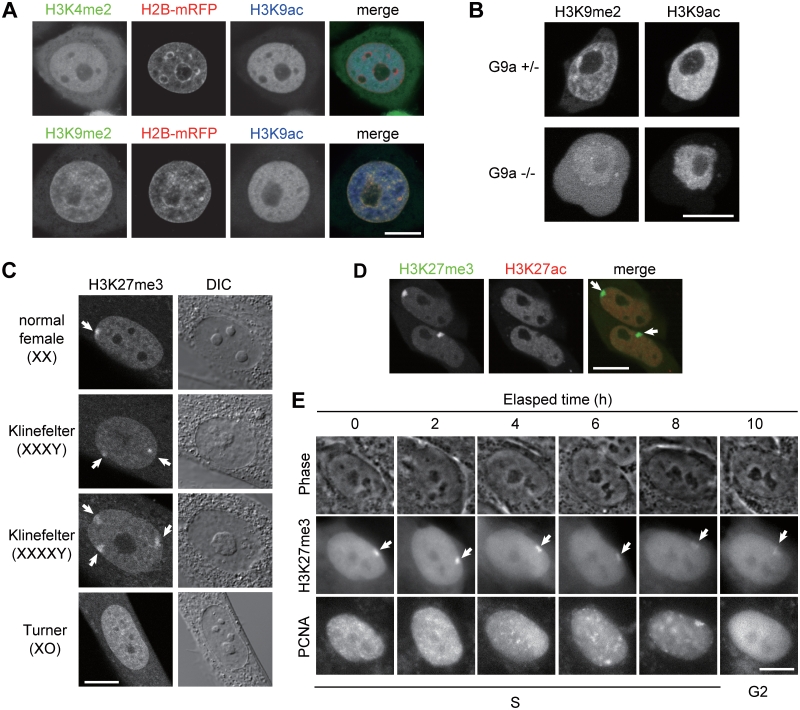
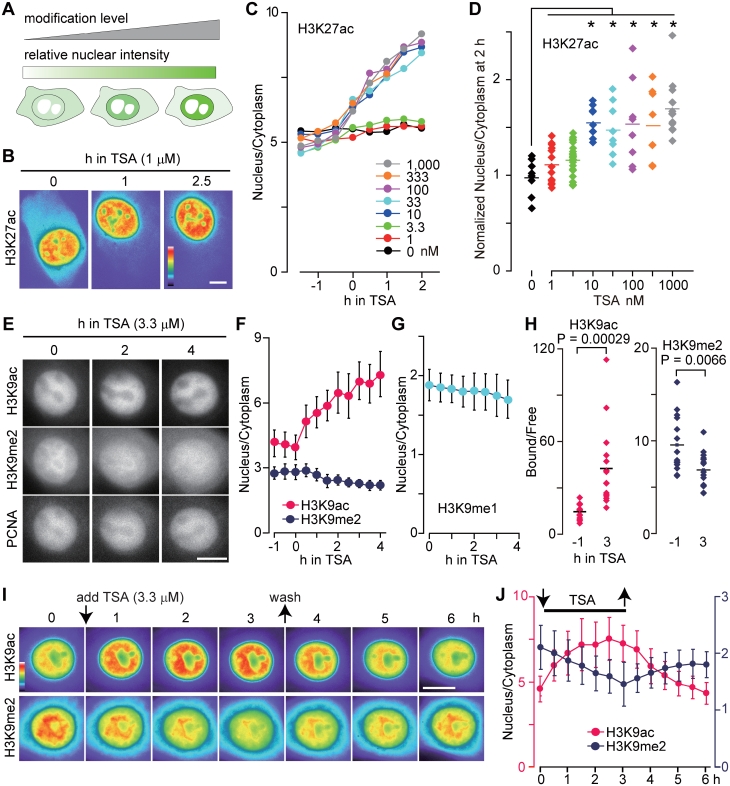
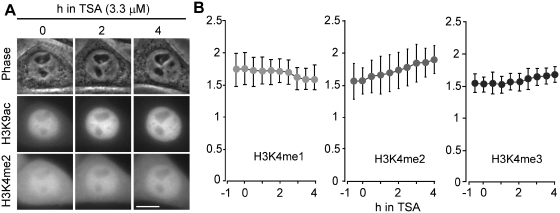
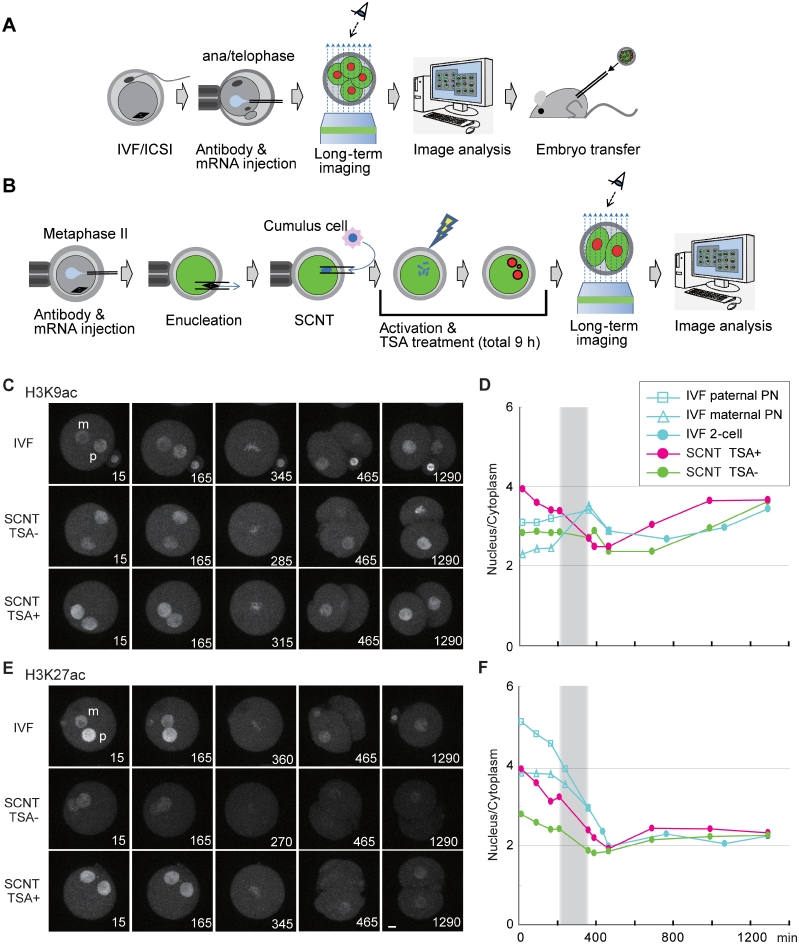
Histone modifications play an important role in epigenetic gene regulation and genome integrity. It remains largely unknown, however, how these modifications dynamically change in individual cells. By using fluorescently labeled specific antigen binding fragments (Fabs), we have developed a general method to monitor the distribution and global level of endogenous histone H3 lysine modifications in living cells without disturbing cell growth and embryo development. Fabs produce distinct nuclear patterns that are characteristic of their target modifications. H3K27 trimethylation-specific Fabs, for example, are concentrated on inactive X chromosomes. As Fabs bind their targets transiently, the ratio of bound and free molecules depends on the target concentration, allowing us to measure changes in global modification levels. High-affinity Fabs are suitable for mouse embryo imaging, so we have used them to monitor H3K9 and H3K27 acetylation levels in mouse preimplantation embryos produced by in vitro fertilization and somatic cell nuclear transfer. The data suggest that a high level of H3K27 acetylation is important for normal embryo development. As Fab-based live endogenous modification labeling (FabLEM) is broadly useful for visualizing any modification, it should be a powerful tool for studying cell signaling and diagnosis in the future.


Figures

Figure 1.
Figure 1.
Histone H3K9 acetylation is visualized in living cells.(A) Schematic drawing showing how histone modifications are visualized in living cells. In the upper path, modification-specific mAb (IgG) is directly conjugated with a fluorescent dye, loaded into the cytoplasm and targeted to nuclear epitopes after cell division. In the lower path, illustrating FabLEM, an additional digestion step is required to make Fab, but targeting to nuclear epitopes takes less than an hour. (B and C) Distribution of Alexa488-labeled H3K9ac specific IgG and Fab. HeLa cells were loaded with IgGH3K9ac-488 (B) or FabH3K9ac-488 (C), and fluorescence images collected every 30 or 5 min (Movies 1 and 2 in Supplementary Data). (D) FabH3K9ac-488 loaded in living HeLa cells distributed similarly to IgGH3K9ac-Cy3 in fixed cells. Confocal images are shown. (E) Time lapse imaging of HeLa cells loaded with FabH3K9ac-488 through multiple cell divisions (Movie 3 in Supplementary Data). Bars, 10 µm.
Figure 2.
Figure 2.
Kinetics of Fabs in living cells. (A) FRAP examples. A small area (2 µm diameter) is bleached and the fluorescence intensity in the bleached area is measured. Bar, 10 µm. (B) FRAP results. The relative intensity of bleached area for the indicated Fabs was plotted (averages of >15 cells) with the recovery t1/2.
Figure 3.
Figure 3.
Localization of methylated histone H3 in living cells. (A–D) Confocal microscope images of living cells. (A) H2B-mRFP-expressing HeLa cells loaded with FabH3K4me2-488, or FabH3K9me2-488, together with FabH3K9ac-Cy3. (B) Nuclear concentration of FabH3K9me2 is diminished in G9a knockout ES cells. FabH3K9me2-488 and FabH3K9ac-Cy3 were loaded into conditional G9a knockout ES cells before (top) and after (bottom) the gene deletion. (C) FabH3K27me3 is concentrated in inactive X chromosomes. Arrows indicate FabH3K27me3 foci. (D) Mouse MC12 cells loaded with FabH3K27me3-488 and FabH3K27ac-Cy3. Arrows indicate FabH3K27me3 foci. (E) Behavior of inactive X chromosomes during S phase. hTERT-RPE1 cells were loaded with FabH3K27me3-488 and PCNA-Cy3, and phase contrast and wide-field fluorescent images were collected every 15 min (Movie 4 in Supplementary Data). Arrows indicate FabH3K27me3-enriched inactive X chromosomes. Bars, 10 µm.
Figure 4.
Figure 4.
Monitoring the levels of histone H3 modifications in living cells. (A) Schematic drawing showing how modification levels are monitored in living cells using Fab. The nuclear concentration of Fab, or the intensity ratio of nucleus:cytoplasm, reflects the level of the target modification. (B–D) Monitoring H3K27ac levels in living U2OS cells. Cells loaded with FabH3K27ac-Cy3 were imaged every 15 min, and TSA was added (Movie 5 in Supplementary Data). Shown are pseudo-color images (B) and the fluorescent intensity ratio of nucleus:cytoplasm (C and D); (C) the average (n > 8); (D) the value of nucleus:cytoplasm at 2 h normalized to its value at 0 h in individual cells. Asterisks indicate P < 0.005 by two-tailed Student’s t-test; actual P-values are: 1 nM, 0.178; 3.3 nM, 0.166; 10 nM, 0.00016; 33 nM, 0.0023; 100 nM, 0.00078; 333 nM, 0.0022; and 1000 nM, 0.0000037. (E–H) Effects of TSA on H3K9 acetylation and methylation levels in HeLa cells. Cells were loaded with FabH3K9ac-Cy5, PCNA-Cy3 and FabH3K9me2-488 (E, F, H) or FabH3K9me1-488 (G), imaged every 15 min, and TSA (3.3 µM) was added. (E) Fluorescent images (Movie 6 in Supplementary Data). (F and G) The intensity ratio of nucleus:cytoplasm (averages with SD; n = 10). (H) The ratio of chromatin-bound:free FabH3K9me2 in individual cells. P-values by two-tailed Student’s t-test are indicated. (I and J) Monitoring H3K9ac and H3K9me2 levels after the removal of TSA. HeLa cells loaded with FabH3K9me2-488 and FabH3K9ac-Cy3 were imaged every 30 min, TSA (3.3 µM) was added at time point 0 and removed 3 h later. (I) Pseudo-color images of fluorescence intensity (see Movie 7 in Supplementary Data for gray scale and merged images). (J) The intensity ratio of nucleus:cytoplasm (averages with SD; n = 10). Bars, 10 µm.
Figure 5.
Figure 5.
Effects of TSA on H3K4 methylation levels. HeLa cells were loaded with FabH3K9ac-Cy5 and FabH3K4me1-488, FabH3K4me2-488, or FabH3K4me3-488, imaged every 15 min, and TSA (3.3 µM) was added. (A) Images of phase-contrast, FabH3K4me2-488 and FabH3K9ac-Cy3. Bar, 10 µm. (B) The intensity ratio of nucleus:cytoplasm (averages with SD; n = 10).
Figure 6.
Figure 6.
Monitoring the levels of histone H3 acetylation in living mouse preimplantation embryos. (A and B) Schematic drawing of mouse embryo imaging. (A) FabLEM perfomed on eggs with in vitro fertilization (IVF) or intracytoplasmic sperm injection (ICSI). Oocytes were fertilized in vitro, injected with a mixture of fluorescently labeled Fab and histone H2B-mRFP1 mRNA at anaphase II-telophase II stage, and then placed on the imaging system. After the imaging, morula–blastocyst stage embryos were transferred to the uterus of the recipient pseudopregnant mothers. (B) FabLEM perfomed on embryos with somatic cell nuclear transfer (SCNT). Metaphase II stage oocytes were injected with a mixture of fluorescently labeled Fab and histone H2B-mRFP1 mRNA, enucleated, and injected with a somatic nucleus derived from a cumulus cell. The reconstructed embryos were activated with SrCl2 and cytochalasin B (±50 nM TSA) for 6 h. The embryos were further incubated (±50 nM TSA) for 3 h. (C–F) Monitoring the levels of histone H3 acetylation. Time-lapse confocal images were acquired for IVF and SCNT (±TSA treated) embryos injected with FabH3K9ac-488 (C and D; Movie 8 in Supplementary Data), or FabH3K27ac-488 (E and F; Movie 9 in Supplementary Data), and mRNA encoding H2B-mRFP. Typical images before and after the first division are shown in (C) and (E). The intensity ratio of nucleus to cytoplasm was measured and the averages (n > 10) are plotted (D and F). Bars, 10 µm.

References

    1. Choudhary C, Mann M. Decoding signalling networks by mass spectrometry-based proteomics. Nat. Rev. Mol. Cell. Biol. 2010;11:427–439. - PubMed
    1. Aye-Han N-N, Ni Q, Zhang J. Fluorescent biosensors for real-time tracking of post-translational modification dynamics. Curr. Opin. Chem. Biol. 2009;13:392–397. - PMC - PubMed
    1. Campos EI, Reinberg D. Histones: annotating chromatin. Annu. Rev. Genet. 2009;43:559–599. - PubMed
    1. Clayton AL, Hazzalin CA, Mahadevan LC. Enhanced histone acetylation and transcription: a dynamic perspective. Mol. Cell. 2006;23:289–296. - PubMed
    1. Morgan HD, Santos F, Green K, Dean W, Reik W. Epigenetic reprogramming in mammals. Hum. Mol. Genet. 2005;14 (Spec No 1), R47–R58. - PubMed

Publication types

MeSH terms