. 2011 May 15;25(10):1041-51.
doi: 10.1101/gad.1987211.

Carnitine palmitoyltransferase 1C promotes cell survival and tumor growth under conditions of metabolic stress

Affiliations

Carnitine palmitoyltransferase 1C promotes cell survival and tumor growth under conditions of metabolic stress

Kathrin Zaugg et al. Genes Dev. .

Abstract

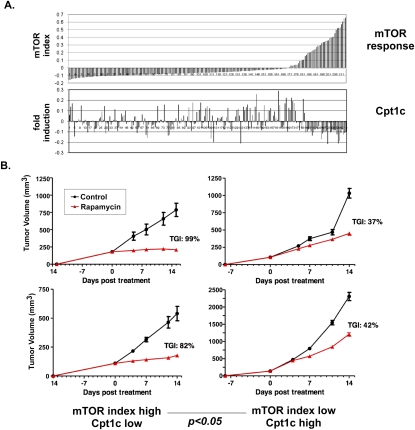
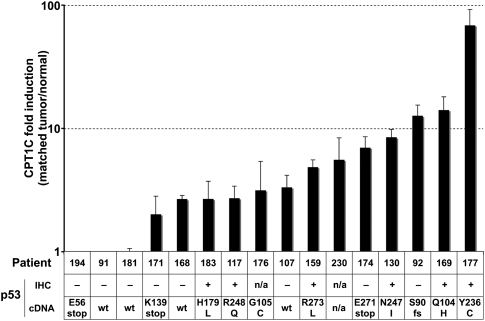
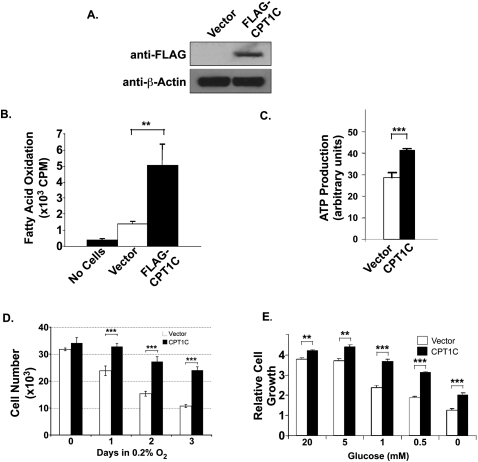
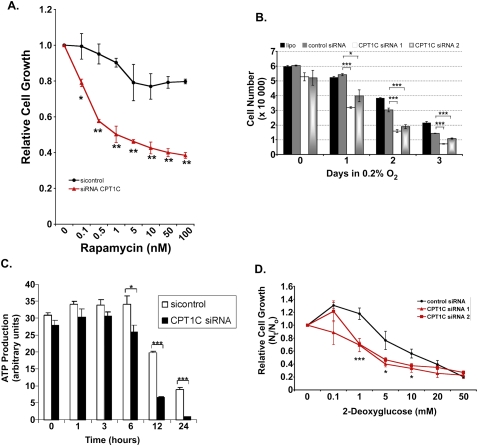
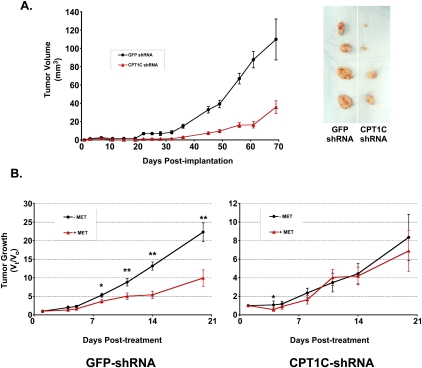
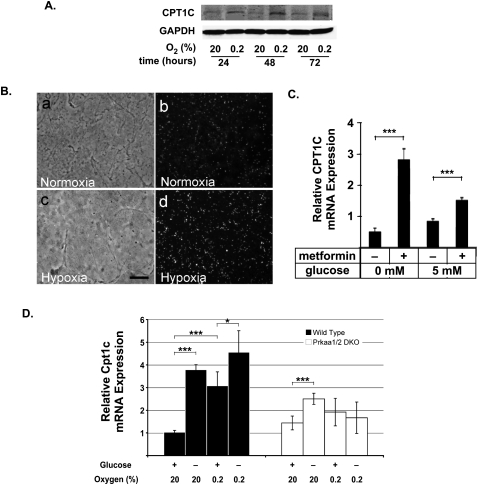
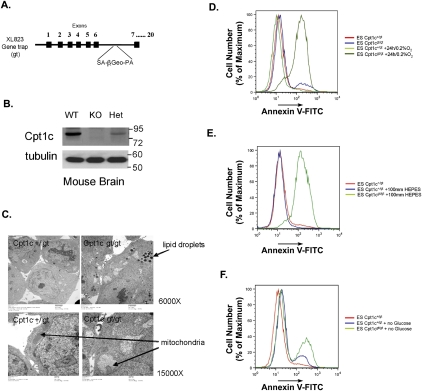
Tumor cells gain a survival/growth advantage by adapting their metabolism to respond to environmental stress, a process known as metabolic transformation. The best-known aspect of metabolic transformation is the Warburg effect, whereby cancer cells up-regulate glycolysis under aerobic conditions. However, other mechanisms mediating metabolic transformation remain undefined. Here we report that carnitine palmitoyltransferase 1C (CPT1C), a brain-specific metabolic enzyme, may participate in metabolic transformation. CPT1C expression correlates inversely with mammalian target of rapamycin (mTOR) pathway activation, contributes to rapamycin resistance in murine primary tumors, and is frequently up-regulated in human lung tumors. Tumor cells constitutively expressing CPT1C show increased fatty acid (FA) oxidation, ATP production, and resistance to glucose deprivation or hypoxia. Conversely, cancer cells lacking CPT1C produce less ATP and are more sensitive to metabolic stress. CPT1C depletion via siRNA suppresses xenograft tumor growth and metformin responsiveness in vivo. CPT1C can be induced by hypoxia or glucose deprivation and is regulated by AMPKα. Cpt1c-deficient murine embryonic stem (ES) cells show sensitivity to hypoxia and glucose deprivation and altered FA homeostasis. Our results indicate that cells can use a novel mechanism involving CPT1C and FA metabolism to protect against metabolic stress. CPT1C may thus be a new therapeutic target for the treatment of hypoxic tumors.


Figures

Figure 1.
Figure 1.
Cpt1c expression correlates inversely with mTOR activation and protects cancer cells against rapamycin. (A) Correlation of Cpt1c expression with mTOR index. Gene expression microarray profiling was performed for 214 murine primary tumors engineered to express human ERBB2 cDNA. The mTOR index is the average of the mean centered expression (MCE) values of the mTOR pathway genes Pik3ca, Frap1, Pik3r3, Pik3r1, and Erbb3. Cpt1c results are the mean MCE value obtained for each tumor using two separate probes. All expression data were determined using Agilent two-color microarray and are reported as the log2 ratio of the signal intensity of cy3-labeled versus cy5-labeled hybridizations. (B) Correlation of Cpt1c expression with rapamycin sensitivity in vivo. Cells from selected tumors in A with a high mTOR index and low Cpt1c or cells from tumors in A with a low mTOR index and high Cpt1c were injected into nude mice and the animals were treated with vehicle (control) or rapamycin for 14 d. New growths were measured at the indicated times; two examples for each group are shown. (TGI) Tumor growth inhibition index.
Figure 2.
Figure 2.
CPT1c is overexpressed in human lung tumors. (Top) Levels of CPT1C mRNA were assayed in human NSCLC tumors and matched normal lung tissues using real-time RT–PCR. Results are the fold change in CPT1C mRNA levels in tumor tissue compared with the matched normal tissue from the same patient. (Bottom) p53 status and mutations are shown for the tumors in the top panel. (IHC) Immunohistochemical staining to detect p53; (cDNA) sequence of p53 exons 4–7; (wt) only wild-type p53 detected; (fs) frameshift mutation.
Figure 3.
Figure 3.
CPT1C overexpression alters FAO, ATP production, and responses to metabolic stress. (A) Validation. MCF-7 cells were stably transfected with control vector or vector expressing Flag-tagged CPT1C protein. Flag-CPT1C expression was confirmed by immunoblotting. (B) Increased FAO. FAO was determined in MCF-7 cells overexpressing CPT1C or control vector as described in the Materials and Methods. Results are mean counts per minute (cpm) ± SD of triplicates. (*) P < 0.05; (**) P < 0.01; (***) P < 0.005 for all figures. (C) Increased ATP production. MCF-7 cells overexpressing CPT1C or control vector were evaluated for ATP production as described in the Materials and Methods. Results are the mean ATP production ± SD of triplicates. (D) Increased resistance to hypoxia. MCF-7 cells overexpressing CPT1C or control vector were cultured for the indicated number of days in 0.2% O2, and cell growth was measured by sulforhodamine B (SRB) staining (see the Materials and Methods). Results shown are the mean growth ± SD of triplicates relative to untreated controls. (E) Increased resistance to glucose deprivation. MCF-7 cells overexpressing CPT1C or control vector were cultured in the indicated concentrations of glucose for 5 d. Cell growth was measured by SRB staining as for D.
Figure 4.
Figure 4.
CPT1C depletion confers sensitivity to rapamycin and metabolic stress. (A) Rapamycin sensitivity. HCT116 cells were transfected with siRNA against CPT1C or control siRNA (sicontrol). Transfected cells were treated with the indicated concentrations of rapamycin for 5 d and cell growth was measured using SRB staining as for Figure 3D. (B) Sensitivity to hypoxia. MCF-7 cells were transfected with no siRNA (lipo), luciferase siRNA (control), or CPT1C siRNA1 or siRNA2. Transfected cells were exposed to hypoxia for the indicated number of days and cell growth was measured by SRB staining as for Figure 3D. (C) Reduced ATP production. PC3 cells were transfected with CPT1C or sicontrol siRNA and cultured in glucose-free medium for the indicated times. ATP production was evaluated as for Figure 3C. (D) Sensitivity to glycolytic inhibition. MCF-7 cells were transfected with control siRNA or CPT1C siRNA1 or siRNA2 and the indicated concentrations of 2-DG were added at 24 h post-transfection. After 5 d culture, cell growth was measured by SRB staining as for Figure 3D.
Figure 5.
Figure 5.
Sustained depletion of CPT1C reduces tumor growth in xenografts. (A) CPT1C depletion inhibits human breast cancer cell growth in vivo. MDA-MB-468 cells were infected with retroviruses expressing pRS-Cpt1c shRNA or pRS-GFP shRNA (control) and injected s.c. into nude mice (n = 5 per group). Tumors were measured twice per week for ∼10 wk. (Left) Results are the mean tumor volume ± SD of all tumors in a group on the indicated day. (Right) Representative images of tumors after excision on day 70 post-implantation. (B) CPT1C-depleted tumors are not responsive to metformin treatment in vivo. HCT116 cells were infected with retroviruses expressing pRS-GFP shRNA or pRS-CPT1C shRNA, and the infected cells were injected s.c. into nude mice (n = 5 per group). The animals were treated once daily with PBS or metformin (250 mg/kg) for 20 d. Results are the mean relative tumor growth of all tumors in a group on the indicated day after treatment.
Figure 6.
Figure 6.
CPT1C is induced by metabolic stress and regulated by AMPK. (A) Induction of CPT1C protein in a cancer cell line subjected to hypoxia. At 24 h post-seeding, HCT116 cells were cultured in 20% or 0.2% O2 for 24 h, 48 h, or 72 h, and CPT1C protein was detected by immunoblotting. (GAPDH) Loading control. (B) Up-regulation of Cpt1c expression in a hypoxia model in vivo. Tumor-bearing PyMT mice were injected with the hypoxia marker EF5 and subjected to hypoxia or normoxia (see the Materials and Methods). Tumors from the normoxic (panels a,b) and hypoxic (panels c,d) animals were examined by bright-field (panels a,c) and dark-field (panels b,d) microscopy. Cpt1c expression was detected by in situ hybridization. Bar, 100 μm. (C) Metformin treatment induces CPT1C expression. MCF-7 cells were cultured for 48 h in medium with or without 10 mM metformin and/or 5 mM glucose, as indicated. Results are mean relative mRNA levels ± SD normalized to Hprt1 expression. (D) Involvement of AMPK in Cpt1c induction upon glucose withdrawal or hypoxia. SV40-transformed wild-type or AMPK-deficient (Prkα1/α2 double knockout; DKO) MEFs were cultured for 24 h in DMEM with (+) or without (−) 25 mM glucose and in 20% or 0.2% O2, as indicated. Cpt1c mRNA levels were assayed by quantitative PCR. Results are mean relative mRNA levels ± SD normalized to Hprt1 expression.
Figure 7.
Figure 7.
Characterization of Cpt1c-deficient ES cells. (A) Diagram of the gene trap Cpt1c allele in ES cell clone XL823 (BayGenomics) showing the splice acceptor (SA) site, β-Geo, and polyadenylation site (PA) integrated into intron 6. (B) Immunoblotting of CPT1C in extracts of brain tissues from Cpt1c+/+ (WT), Cpt1cgt/gt (KO), and Cpt1c+/gt (Het) mice. (Tubulin) Loading control. (C) Altered morphology. The morphology of Cpt1c+/gt and Cpt1cgt/gt ES cells was examined by electron microscopy. Cpt1cgt/gt cells show cytoplasmic lipid droplets (top) and swollen mitochondria lacking internal structure (bottom). Results are representative of two trials. (D) Increased death under hypoxia. Cpt1c+/gt and Cpt1cgt/gt cells were cultured for 24 h under normoxia or hypoxia (0.2% O2) and cell death was detected using Annexin V staining and flow cytometry. (E) Hypoxia-induced acidosis does not cause the death of Cpt1cgt/gt cells. Cpt1c+/gt and Cpt1cgt/gt ES cells were treated as in C with the addition of 100 mM HEPES. Cell death was measured as for C. (F) Increased death upon glucose withdrawal. Cpt1c+/gt and Cpt1cgt/gt ES cells were cultured for 48 h in DMEM or DMEM with no glucose. Cell death was measured as for C. For D–F, results are representative of two trials.

References

    1. Brown JM, Wilson WR 2004. Exploiting tumour hypoxia in cancer treatment. Nat Rev Cancer 4: 437–447 - PubMed
    1. Buck E, Eyzaguirre A, Brown E, Petti F, McCormack S, Haley JD, Iwata KK, Gibson NW, Griffin G 2006. Rapamycin synergizes with the epidermal growth factor receptor inhibitor erlotinib in non-small-cell lung, pancreatic, colon, and breast tumors. Mol Cancer Ther 5: 2676–2684 - PubMed
    1. Bungard D, Fuerth BJ, Zeng PY, Faubert B, Maas NL, Viollet B, Carling D, Thompson CB, Jones RG, Berger SL 2010. Signaling kinase AMPK activates stress-promoted transcription via histone H2B phosphorylation. Science 329: 1201–1205 - PMC - PubMed
    1. Bunz F, Dutriaux A, Lengauer C, Waldman T, Zhou S, Brown JP, Sedivy JM, Kinzler KW, Vogelstein B 1998. Requirement for p53 and p21 to sustain G2 arrest after DNA damage. Science 282: 1497–1501 - PubMed
    1. Buzzai M, Jones RG, Amaravadi RK, Lum JJ, DeBerardinis RJ, Zhao F, Viollet B, Thompson CB 2007. Systemic treatment with the antidiabetic drug metformin selectively impairs p53-deficient tumor cell growth. Cancer Res 67: 6745–6752 - PubMed

Publication types

MeSH terms

Substances

LinkOut - more resources