. 2011 Jul;31(14):2787-801.
doi: 10.1128/MCB.05437-11. Epub 2011 May 16.

mTOR kinase domain phosphorylation promotes mTORC1 signaling, cell growth, and cell cycle progression

Affiliations

mTOR kinase domain phosphorylation promotes mTORC1 signaling, cell growth, and cell cycle progression

Bilgen Ekim et al. Mol Cell Biol. 2011 Jul.

Abstract

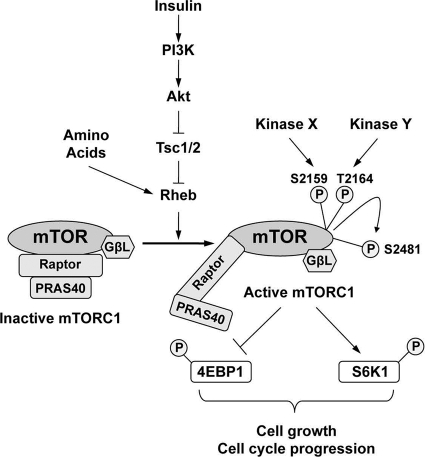
The mammalian target of rapamycin complex 1 (mTORC1) functions as an environmental sensor to promote critical cellular processes such as protein synthesis, cell growth, and cell proliferation in response to growth factors and nutrients. While diverse stimuli regulate mTORC1 signaling, the direct molecular mechanisms by which mTORC1 senses and responds to these signals remain poorly defined. Here we investigated the role of mTOR phosphorylation in mTORC1 function. By employing mass spectrometry and phospho-specific antibodies, we demonstrated novel phosphorylation on S2159 and T2164 within the mTOR kinase domain. Mutational analysis of these phosphorylation sites indicates that dual S2159/T2164 phosphorylation cooperatively promotes mTORC1 signaling to S6K1 and 4EBP1. Mechanistically, S2159/T2164 phosphorylation modulates the mTOR-raptor and raptor-PRAS40 interactions and augments mTORC1-associated mTOR S2481 autophosphorylation. Moreover, mTOR S2159/T2164 phosphorylation promotes cell growth and cell cycle progression. We propose a model whereby mTOR kinase domain phosphorylation modulates the interaction of mTOR with regulatory partner proteins and augments intrinsic mTORC1 kinase activity to promote biochemical signaling, cell growth, and cell cycle progression.


Figures

Fig. 1.
Fig. 1.
Identification of S2159 and T2164 as novel sites of mTOR phosphorylation. (A) P-S2159 and P-T2164 antibodies are site specific. HEK293 cells seeded on 10-cm plates were transiently transfected with vector control or various Myc-mTOR alleles (10 μg) and cultured in DMEM-FBS. Myc-mTOR was immunoprecipitated (IP) from whole-cell lysate (WCL) with Myc antibodies and immunoblotted (IB) with the indicated antibodies. Each lane represents an IP from WCL containing ∼300 μg protein. (B) S2159 and T2164 are not sites of mTOR autophosphorylation. Flp-In HEK293 cells that stably express vector control or various AU1-mTOR alleles were cultured in DMEM-FBS containing hygromycin. AU1-mTOR was immunoprecipitated from WCL with AU1 antibodies and immunoblotted with the indicated antibodies. Each lane represents an IP from WCL containing ∼1,250 μg protein. WCL was also immunoblotted directly. (C) Endogenous mTOR undergoes phosphorylation on S2159 and T2164. HEK293 cells were cultured in DMEM-FBS. Endogenous mTOR was immunoprecipitated from WCL with mTOR antibodies and immunoblotted with the indicated antibodies (Ab). Each lane represents an IP from WCL containing ∼5 mg protein. (D) Localization of S2159/T2164, as well as S1261 and S2481, within the mTOR domain structure and alignment of mTOR S2159/T2164 from various organisms using the algorithm Clustal W. S2159 and T2164 lie at the beginning of the mTOR kinase domain (positions 2153 to 2431).
Fig. 2.
Fig. 2.
mTOR S2159/T2164 phosphorylation promotes mTORC1 signaling to S6K1. (A) mTOR S2159/T2164 phosphorylation promotes S6K1 phosphorylation in the absence and presence of insulin (INS). HEK293 cells were transiently transfected with vector control or cotransfected with various AU1-mTOR alleles (5 μg) together with HA-S6K1 (0.5 μg) and cultured in DMEM-FBS. Transfected cells were serum deprived (20 h), pretreated without or with rapamycin (20 ng/ml) for 30 min, incubated in the absence or presence of insulin (100 nM) for 30 min, and then lysed. HA-S6K1 was immunoprecipitated from WCL with HA antibodies and immunoblotted with the indicated antibodies (upper panels). WCL was also immunoblotted directly (lower panels). LE, light exposure; DE, dark exposure. (B) mTOR S2159/T2164 phosphorylation promotes S6K1 phosphorylation under steady-state conditions. The procedure was similar to that described for panel A except that cycling cells were cultured in DMEM-FBS and pretreated without or with rapamycin (20 ng/ml) for 2 h prior to lysis. (C) Within the mTOR RR-2 backbone, mTOR S2159/T2164 phosphorylation promotes S6K1 phosphorylation in response to insulin. The procedure was similar to that described for panel A, except that an alternate rapamycin-resistant mTOR allele was employed, which contains S2035W (RR-2) rather than the more commonly used S2035I (RR). (D) Phospho-mimetic DE-mTOR (S2159D/T2164E) rescues mTORC1 signaling better than phospho-defective AA-mTOR (S2159A/T2164A) after mTOR knockdown. Cells infected with lentiviruses encoding scrambled shRNA (Scr) or shRNA engineered to knock down endogenous mTOR (human) but not exogenous AU1-mTOR (rat) were transfected with various Myc-mTOR alleles (5 μg). WCL was immunoblotted directly with the indicated antibodies. (E) mTOR S2159/T2164 phosphorylation promotes S6K1 phosphorylation in response to amino acids. The procedure was similar to that described for panel A except that prior to lysis transfected cells were pretreated without or with rapamycin (20 ng/ml) for 30 min, amino acid deprived (60 min), and then stimulated with amino acids (30 min) via incubation in DMEM-FBS in the continuous absence or presence of rapamycin.
Fig. 3.
Fig. 3.
mTOR S2159/T2164 phosphorylation increases the sensitivity and duration of insulin-stimulated mTORC1 signaling. (A) Insulin dose response. The procedure was similar to that described for Fig. 2A except that cells were stimulated with various concentrations of insulin for 30 min as indicated. (B) Insulin time course. The procedure was similar to that described for Fig. 2A except that cells were stimulated with insulin (100 nM) for various amounts of time as indicated. LE, light exposure; DE, dark exposure. (C and D) Phosphorylation on mTOR S2159 and T2164 each contributes to insulin-stimulated mTORC1 signaling. The procedure was similar to that described for Fig. 2A.
Fig. 4.
Fig. 4.
Phosphorylation of mTOR S2159/T2164 promotes mTORC1 signaling to 4EBP1. HEK293 cells on 10-cm plates were transfected with various AU1-mTOR alleles (7 μg) together with 3HA-4EBP1 (2 μg) and Myc-raptor (1 μg), deprived of serum (20 h), incubated in the absence or presence of insulin (100 nM) for 30 min, and lysed in buffer A containing CHAPS. HEK293 lysate was incubated with m7GTP-Sepharose beads to pull down eIF4E and associated 4EBP1. m7GTP pulldowns and WCL were resolved by SDS-PAGE and immunoblotted with the indicated antibodies. LE, light exposure; DE, dark exposure. The P-4EBP1-S65 signal represents endogenous 4EBP1, as it is much stronger than the P-S65 signal on exogenous HA-4EBP1.
Fig. 5.
Fig. 5.
mTOR S2159/T2164 phosphorylation weakens the mTOR-raptor and raptor-PRAS40 interactions and augments mTORC1 intrinsic kinase activity. (A) mTOR S2159/T2164 phosphorylation alters the interaction of mTOR with raptor but not mLST8/GβL. HEK293 cells were cotransfected with HA-mLST8/GβL (0.5 μg) and HA-raptor (0.5 μg) together with various Myc-mTOR alleles (4 μg), cultured in DMEM-FBS, serum deprived (20 h), incubated in the absence or presence of insulin (100 nM) for 30 min, and lysed in buffer B containing CHAPS. Myc-mTOR was immunoprecipitated from WCL with Myc antibodies and immunoblotted as indicated (upper panels). WCL was also immunoblotted directly (lower panels). The phosphorylation of endogenous rpS6 confirmed cellular insulin stimulation. (B) mTOR S2159/T2164 phosphorylation alters the interaction of raptor with PRAS40. HEK293 cells seeded on 10-cm plates were cotransfected with various AU1-mTOR alleles (10 μg) together with Myc-raptor (0.5 μg), cultured in DMEM-FBS, serum deprived (20 h), incubated in the absence or presence of insulin (100 nM), and lysed in buffer A containing CHAPS. Myc-raptor was immunoprecipitated from WCL with Myc antibodies and immunoblotted as indicated (upper panels). WCL was also immunoblotted directly (lower panels). LE, light exposure; DE, dark exposure. (C) mTOR S2159/T2164 phosphorylation is required for mTORC1-associated mTOR S2481 autophosphorylation. HEK293 cells were cotransfected with various Myc-mTOR alleles (2.5 μg) together with HA-raptor (0.5 μg) and Flag-Rheb (2.5 μg), as indicated. Cells were serum deprived (20 h) and lysed. HA-raptor was immunoprecipitated from WCL with HA antibodies to immunoisolate mTORC1 and immunoblotted as indicated (upper panels). WCL was also immunoblotted directly (lower panels).
Fig. 6.
Fig. 6.
mTOR S2159/T2164 phosphorylation promotes mTORC1-mediated cell growth and G1-phase cell cycle progression. (A) Biochemical analysis of stable HEK293 Flp-In cell lines. mTOR S2159/T2164 phosphorylation promotes S6K1 and 4EBP1 phosphorylation in response to insulin. Cells expressing various AU1-mTOR alleles were serum deprived (20 h), pretreated without or with rapamycin (20 ng/ml) for 30 min, incubated in the absence or presence of insulin (100 nM) for 30 min, and lysed. WCL was immunoblotted directly. (B) mTOR S2159/T2164 phosphorylation promotes cell growth to increased cell size. Cells stably expressing various AU1-mTOR alleles were cultured for 96 h in the absence or presence of rapamycin. The relative size of subconfluent cells was determined using a flow cytometer via the parameter mean FSC-H. The graph shows mean FSC-H (± standard deviation [SD]) of G1-phase cells from three experiments, two performed in quadruplicate and one in triplicate (n = 11). The size of cells expressing RR-mTOR and cultured in the presence of rapamycin was set to 100%. All other samples were normalized to this value. Statistical significance was determined using one-way analysis of variance (ANOVA) followed by Tukey's post hoc tests. The letters (a to e) indicate significance at a P value of <0.05. (C) Expression of the various AU1-mTOR alleles and phosphorylation of rpS6 from one representative cell size experiment. (D) mTOR S2159/T2164 phosphorylation promotes G1-phase cell cycle progression. Flp-In HEK293 cells stably expressing various AU1-mTOR alleles were serum deprived for 24 h and then stimulated with serum-containing medium (DMEM-FBS) in the absence or presence of rapamycin (20 ng/ml) for an additional 24 h. DNA content was determined on a flow cytometer after propidium iodide staining. The graph shows the percentage of cells in G1 phase following serum stimulation in the absence or presence of rapamycin. Mean values (± SD) from one representative experiment performed in quadruplicate are shown (n = 4). Statistical significance was determined using one-way analysis of variance (ANOVA) followed by Tukey's post hoc tests. The letters (a to c) indicate that the G1-phase percentage means are significantly different at a P value of <0.05.
Fig. 7.
Fig. 7.
mTOR-S2159D/T2164E (DE) but not S2159A/T2164A (AA) promotes cell growth to an increased cell size during a cell cycle block. (A and B) 2-Hydroxyurea (2-HU) treatment induces an S-phase cell cycle block, which results in increased cell size in an mTORC1-dependent manner. Stable HEK293 Flp-In cell lines expressing AU1-mTOR-WT were cultured for 96 h in the absence or presence of rapamycin (20 ng/ml) and/or hydroxyurea (0.5 mM). (A and B) DNA content (A) or cell size (B) was determined on a flow cytometer after propidium iodide staining. (A) Representative histogram from an experiment performed in quadruplicate. The inset shows the percentage of cells in the various cell cycle phases (mean for quadruplicate samples). (B) Mean FSC-H (± SD) of G1-phase cells from quadruplicate samples (n = 4). The size of WT-mTOR-expressing cells cultured in the absence of rapamycin and hydroxyurea was set to 100%. All other samples were normalized to this value. Statistical significance was determined using one-way analysis of variance (ANOVA) followed by Tukey's post hoc tests. The letters (a to d) indicate significance at a P value of <0.05. (C and D) During a cell cycle block, RR/DE- but not RR/AA-mTOR-expressing cells display increased cell size. HEK293 Flp-In cells stably expressing various AU1-mTOR alleles were cultured and analyzed as for panels A and B. (C) Cell size; (D) DNA content. Results from a representative experiment performed in quadruplicate are shown (n = 4).
Fig. 8.
Fig. 8.
Model (see Discussion).

Similar articles

Cited by

References

    1. Acosta-Jaquez H. A., et al. 2009. Site-specific mTOR phosphorylation promotes mTORC1-mediated signaling and cell growth. Mol. Cell. Biol. 29:4308–4324 - PMC - PubMed
    1. Alessi D. R., Pearce L. R., Garcia-Martinez J. M. 2009. New insights into mTOR signaling: mTORC2 and beyond. Sci. Signal. 2:pe27. - PubMed
    1. Avruch J., et al. 2009. Activation of mTORC1 in two steps: Rheb-GTP activation of catalytic function and increased binding of substrates to raptor. Biochem. Soc. Trans. 37:223–226 - PubMed
    1. Bhaskar P. T., Hay N. 2007. The two TORCs and Akt. Dev. Cell 12:487–502 - PubMed
    1. Carriere A., et al. 2008. Oncogenic MAPK signaling stimulates mTORC1 activity by promoting RSK-mediated raptor phosphorylation. Curr. Biol. 18:1269–1277 - PubMed

Publication types

MeSH terms

Substances

LinkOut - more resources