. 2011 Jun 6;208(6):1267-78.
doi: 10.1084/jem.20102551. Epub 2011 May 16.

Lipid phosphate phosphatase 3 enables efficient thymic egress

Affiliations

Lipid phosphate phosphatase 3 enables efficient thymic egress

Béatrice Bréart et al. J Exp Med. .

Abstract

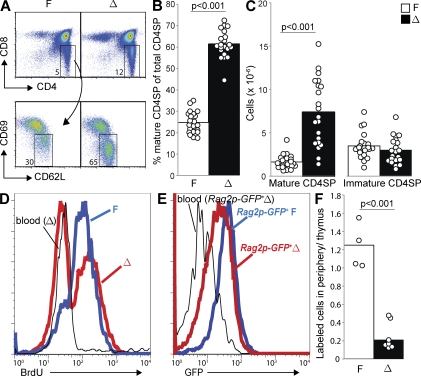
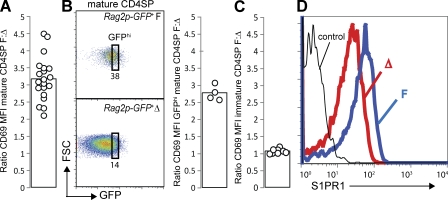
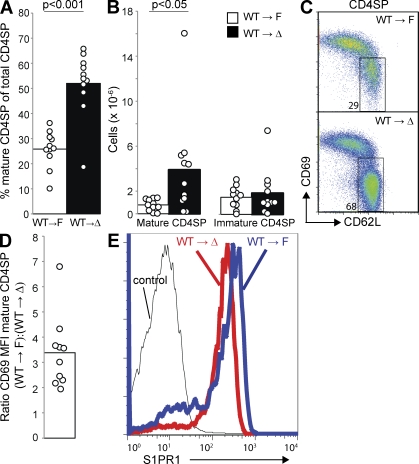
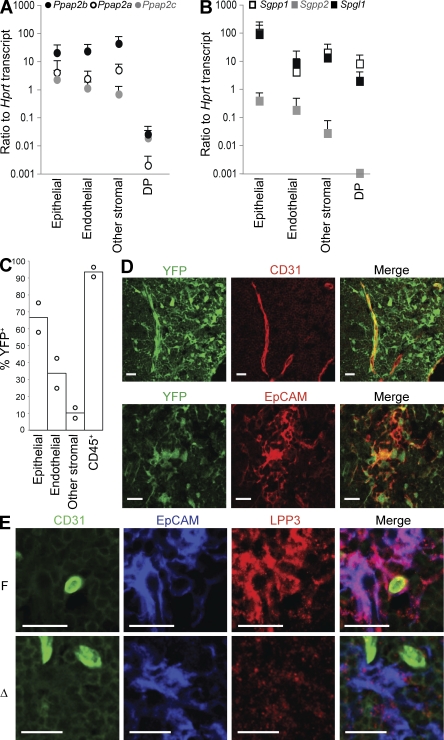
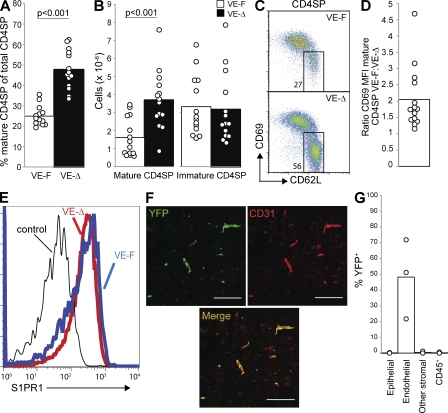
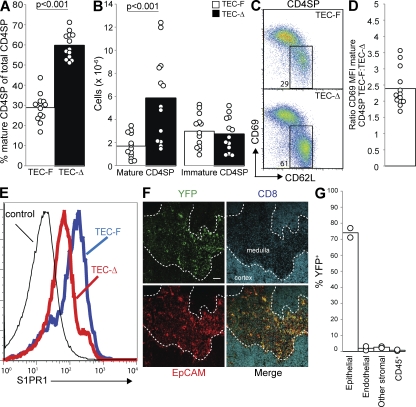
The signaling lipid sphingosine-1-phosphate (S1P) stabilizes the vasculature, directs lymphocyte egress from lymphoid organs, and shapes inflammatory responses. However, little is known about how S1P distribution is controlled in vivo, and it is not clear how a ubiquitously made lipid functions as a signal that requires precise spatial and temporal control. We have found that lipid phosphate phosphatase 3 (LPP3) enables efficient export of mature T cells from the thymus into circulation, and several lines of evidence suggest that LPP3 promotes exit by destroying thymic S1P. Although five additional S1P-degrading enzymes are expressed in the thymus, they cannot compensate for the loss of LPP3. Moreover, conditional deletion of LPP3 in either epithelial cells or endothelial cells is sufficient to inhibit egress. These results suggest that S1P generation and destruction are tightly regulated and that LPP3 is essential to establish the balance.


Figures

Figure 1.
Figure 1.
LPP3 is required for efficient thymic egress. LPP3-deficient mice (Δ; Ppap2bf/−Mx1Cre+ or Ppap2bf/fMx1Cre+, treated with pI-pC 3–5 d after birth) and littermate controls (F; Ppap2bf/+Mx1Cre+, Ppap2b+/−Mx1Cre+, Ppap2bf/−, Ppap2bf/f, Ppap2bf/+, or Ppap2b+/−, treated with pI-pC 3–5 d after birth at the same time as LPP3-deficient mice) were analyzed at 6 wk or older. (A) Expression of CD4 and CD8 by total thymocytes (top) and expression of CD69 and CD62L by CD4SP (CD4+CD8) thymocytes (bottom) from a representative LPP3-deficient mouse (Δ) and littermate control (F). (B) Percentage of mature CD4SP thymocytes (CD4+CD8CD62LhiCD69lo) among total CD4SP thymocytes. (C) Total number of mature CD4SP thymocytes and immature CD4SP thymocytes (CD4+CD8CD62LloCD69hi). In B and C, each point represents an individual mouse and bars show the mean. Graphs are a compilation of 13 experiments with a total of 21 mice per group. In all figures, p-values were calculated using the two-tailed unpaired Student’s t test. (D) LPP3-deficient mice and littermate controls were treated with 0.8 mg/ml BrdU in the drinking water for 11 d. BrdU incorporation by mature CD4SP thymocytes, as well as naive blood CD4+ T cells, was measured by flow cytometry. Data are representative of three pairs of mice analyzed in three experiments. (E) GFP levels of mature CD4SP thymocytes from a representative Rag2p-GFP+ LPP3-deficient (Δ) mouse, mature CD4SP thymocytes from its Rag2p-GFP+ littermate control (F), and naive (CD69LhiCD69lo) CD4+ T cells from the blood of the LPP3-deficient Rag2p-GFP+ mouse, measured by flow cytometry. Data are representative of four pairs of mice analyzed in two experiments. (F) Sulfo-NHS biotin was injected into the thymus of LPP3-deficient mice and littermate controls. 16 h later, biotin-labeled mature CD4SP T cells in the thymus and CD4+ T cells in the periphery (combined blood, spleen, mesenteric, inguinal, axillary, and brachial LNs) were enumerated. The graph shows the ratio of the number of labeled cells in the periphery to the number of labeled cells remaining in the thymus. Each point represents an individual mouse and bars show the mean. The graph compiles data from seven LPP3-deficient mice and four littermate controls analyzed in two experiments. Mature T cells in the thymus of LPP3-deficient and littermate controls were labeled with similar efficiency (mean 57 and 62%, respectively).
Figure 2.
Figure 2.
LPP3 deficiency causes down-modulation of CD69 and S1PR1. (A) The ratio of CD69 MFI of mature CD4SP thymocytes from littermate controls (F)/CD69 MFI of mature CD4SP thymocytes from LPP3-deficient mice (Δ). Each point represents one pair of mice, and the bar represents the mean. The graph compiles 13 experiments with a total of 21 pairs of mice. (B) Dot plots (left) show expression of GFP versus forward scatter (FSC) by mature CD4SP T cells from a representative Rag2p-GFP+ LPP3-deficient mouse (Δ) and Rag2p-GFP+ littermate control (F), and they indicate the GFPhi gate. The GFP MFI within the GFPhi gate differs by <10% between littermate controls and LPP3-deficient mice. The bar graph (right) shows the ratio of CD69 MFI of GFPhi mature CD4SP thymocytes from Rag2p-GFP+ littermate controls/CD69 MFI of GFPhi mature CD4SP thymocytes from Rag2p-GFP+ LPP3-deficient mice. Each point represents one pair of mice, and each bar represents the mean. The graph compiles data from four pairs of mice analyzed in two experiments. (C) The ratio of CD69 MFI of immature CD4SP thymocytes from littermate controls (F)/CD69 MFI of immature CD4SP thymocytes from LPP3-deficient mice (Δ). Each point represents one pair of mice, and each bar represents the mean. The graph compiles six experiments with a total of eight pairs of mice. (D) Surface S1PR1 levels on mature CD4SP thymocytes. The thin line shows staining with a control antibody. Data are representative of three pairs of mice analyzed in three experiments.
Figure 3.
Figure 3.
LPP3 is required in radiation-resistant cells to maintain low thymic S1P. CD45.2+ LPP3-deficient (Δ) mice and littermate controls (F) were lethally irradiated and reconstituted with CD45.1+ WT BM. The chimeras were analyzed 7–10 wk later. All analyses are gated on WT thymocytes (94–99% of total). (A) Percentage of mature CD4SP thymocytes among total CD4SP thymocytes. (B) Total number of mature CD4SP thymocytes and immature CD4SP thymocytes. In A and B, each point represents an individual mouse and bars show the mean. Graphs are a compilation of four experiments with a total of 10–11 mice per group. (C) Expression of CD69 and CD62L on CD4SP thymocytes. (D) The ratio of CD69 MFI of mature CD4SP thymocytes from littermate control chimeras/CD69 MFI of mature CD4SP thymocytes from LPP3-deficient chimeras. Each point represents one pair of mice, and the bar represents the mean. The graph compiles 10 pairs of mice analyzed in four experiments. (E) Surface S1PR1 expression on mature CD4SP thymocytes. The thin line shows staining with a control antibody. Data are representative of three pairs of mice analyzed in three experiments.
Figure 4.
Figure 4.
LPP3 is expressed by multiple radiation-resistant cell types. (A and B) Abundance of mRNA transcripts encoding the indicated S1P degrading enzymes, expressed relative to Hprt (hypoxanthine-guanine phosphoribosyltransferase) transcript, in sorted thymic populations, measured by quantitative RT-PCR. Ppap2a, LPP1; Ppap2b, LPP3; Ppap2c, LPP2; Sgpp1, SPP1; Sgpp2, SPP2; and Spgl1, S1P lyase. Endothelial cells were defined as CD45CD31+, epithelial cells as CD45EpCAM+, other stromal cells as CD45CD31EpCAM, and DP T cells as CD4+CD8+ (none of the transcripts differ among DP, immature CD4SP, or mature CD4SP T cells, not depicted). The point shows the mean, and the vertical line shows the standard deviation. Data compile three to six experiments with mice on a B6 or a B6 × 129 mixed background (the results did not differ by strain). Each experiment is a separate cell purification from three to four pooled mice, RNA extraction, and quantitative RT-PCR. (C) R26R-EYFP+ Mx1Cre+ mice were treated with pI-pC 3–5 d after birth and analyzed at least 6 wk later. YFP expression by disaggregated thymic cell populations was measured by flow cytometry. CD45+ cells are primarily T cells, as they were isolated by mechanical disruption. Each point represents an individual mouse, and bars show the mean. The graph compiles two mice analyzed in two experiments. (D) R26R-EYFP+ Mx1Cre+ mice were treated with pI-pC 3–5 d after birth. Adults were lethally irradiated and reconstituted with WT BM. The resulting chimeras were analyzed 7–10 wk later. Frozen thymic sections were stained for CD31 to mark endothelial cells or EpCAM to mark epithelial cells and visualized by confocal microscopy. Bars, 20 µm. The image is representative of two mice analyzed in two experiments. (E) Frozen thymic sections from LPP3-deficient mice and littermate controls were stained for CD31 to mark endothelial cells, EpCAM to mark epithelial cells, and LPP3 and were visualized by confocal microscopy. Bars, 20 µm. The image is representative of two pairs of mice analyzed in two experiments.
Figure 5.
Figure 5.
LPP3 expression by endothelial cells is required to maintain low thymic S1P. Mice in which LPP3 was deleted by VE-Cadherin-CreERT2 (VE-Δ; Ppap2bf/−Cdh5(PAC)-CreERT2+, treated with tamoxifen at 3–4 wk old) or littermate controls (VE-F; Ppap2bf/+ Cdh5(PAC)-CreERT2+, Ppap2bf/+, or Ppap2bf/-, treated with tamoxifen at 3–4 wk old) were analyzed at least 4 wk after tamoxifen treatment. (A) Percentage of mature CD4SP thymocytes among total CD4SP thymocytes. (B) Total number of mature CD4SP thymocytes and immature CD4SP thymocytes. In A and B, each point represents an individual mouse and bars show the mean. Graphs are a compilation of 11 experiments with a total of 14 mice per group. (C) Expression of CD69 and CD62L on CD4SP thymocytes. (D) The ratio of CD69 MFI of mature CD4SP thymocytes from littermate controls/CD69 MFI of mature CD4SP thymocytes from VE-Δ mice. Each point represents one pair of mice, and the bar represents the mean. The graph compiles 14 pairs of mice analyzed in 11 experiments. (E) Surface S1PR1 expression on mature CD4SP thymocytes. The thin line shows staining with a control antibody. We saw slight down-modulation in two experiments and no detectable shift in a third. (F) Frozen thymic sections from tamoxifen-treated R26R-EYFP+Cdh5(PAC)-CreERT2+ mice were stained for CD31 to mark endothelial cells and visualized by confocal microscopy. Bars, 100 µm. The image is representative of two mice analyzed in two experiments. (G) YFP expression by disaggregated thymic cell populations from tamoxifen-treated R26R-EYFP+Cdh5(PAC)-CreERT2+ mice was measured by flow cytometry. CD45+ cells are primarily T cells, as they were isolated by mechanical disruption. Each point represents an individual mouse, and bars show the mean. The graph compiles three mice analyzed in three experiments.
Figure 6.
Figure 6.
LPP3 expression by epithelial cells is required to maintain low thymic S1P. Mice in which LPP3 was deleted by Keratin14-Cre (TEC-Δ; Ppap2bf/−Krt14Cre+) or littermate controls (TEC-F; Ppap2bf/+Krt14Cre+, Ppap2bf/+, or Ppap2bf/−) were analyzed at 6 wk or older. (A) Percentage of mature CD4SP thymocytes among total CD4SP thymocytes. (B) Total number of mature CD4SP thymocytes and immature CD4SP thymocytes. In A and B, each point represents an individual mouse and bars show the mean. Graphs compile 11 experiments with a total of 13 mice per group. (C) Expression of CD69 and CD62L on CD4SP thymocytes. (D) The ratio of CD69 MFI of mature CD4SP thymocytes from littermate controls/CD69 MFI of mature CD4SP thymocytes from TEC-Δ mice. Each point represents one pair of mice and the bar represents the mean. The graph compiles 13 pairs of mice analyzed in 11 experiments. (E) Surface S1PR1 expression on mature CD4SP thymocytes. Thin line shows staining with a control antibody. Data are representative of three pairs of mice analyzed in three experiments. (F) Frozen thymic sections from R26R-EYFP+Krt14Cre+ mice were stained for EpCAM to mark epithelial cells and CD8 to distinguish the cortex from the medulla and visualized by confocal microscopy. Bar, 100 µm. Image is representative of two mice in two experiments. (G) YFP expression by disaggregated thymic cell populations from R26R-EYFP+Krt14Cre+ mice was measured by flow cytometry. CD45+ cells are primarily T cells, as they were isolated by mechanical disruption. Each point represents an individual mouse and bars show the mean. The graph compiles two mice analyzed in two experiments.

References

    1. Alfonso C., McHeyzer-Williams M.G., Rosen H. 2006. CD69 down-modulation and inhibition of thymic egress by short- and long-term selective chemical agonism of sphingosine 1-phosphate receptors. Eur. J. Immunol. 36:149–159 10.1002/eji.200535127 - DOI - PubMed
    1. Allende M.L., Dreier J.L., Mandala S., Proia R.L. 2004. Expression of the sphingosine 1-phosphate receptor, S1P1, on T-cells controls thymic emigration. J. Biol. Chem. 279:15396–15401 10.1074/jbc.M314291200 - DOI - PubMed
    1. Alvarez S.E., Harikumar K.B., Hait N.C., Allegood J., Strub G.M., Kim E.Y., Maceyka M., Jiang H., Luo C., Kordula T., et al. 2010. Sphingosine-1-phosphate is a missing cofactor for the E3 ubiquitin ligase TRAF2. Nature. 465:1084–1088 10.1038/nature09128 - DOI - PMC - PubMed
    1. Barilà D., Plateroti M., Nobili F., Muda A.O., Xie Y., Morimoto T., Perozzi G. 1996. The Dri 42 gene, whose expression is up-regulated during epithelial differentiation, encodes a novel endoplasmic reticulum resident transmembrane protein. J. Biol. Chem. 271:29928–29936 10.1074/jbc.271.47.29928 - DOI - PubMed
    1. Blair-Handon R., Mueller K., Hoogstraten-Miller S. 2010. An alternative method for intrathymic injections in mice. Lab Anim. (NY.). 39:248–252 10.1038/laban0810-248 - DOI - PMC - PubMed

Publication types

MeSH terms