. 2011 May 31;108(22):9256-61.
doi: 10.1073/pnas.1018790108. Epub 2011 May 16.

Minimally invasive molecular delivery into the brain using optical modulation of vascular permeability

Affiliations

Minimally invasive molecular delivery into the brain using optical modulation of vascular permeability

Myunghwan Choi et al. Proc Natl Acad Sci U S A. .

Abstract

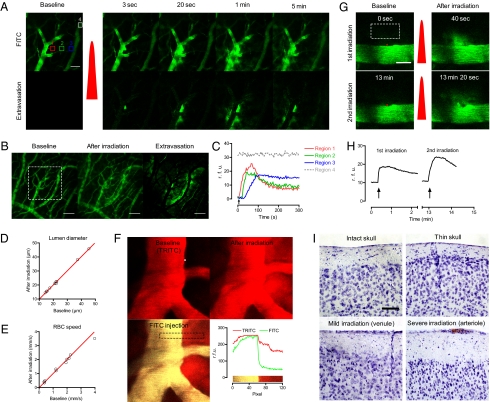
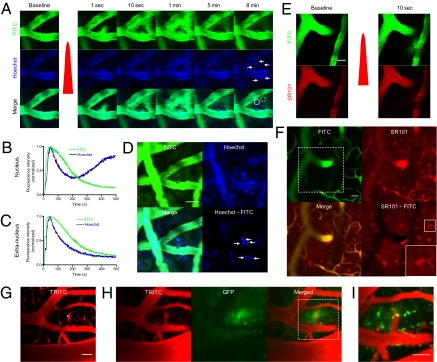
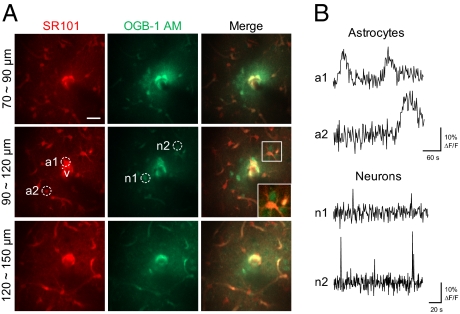
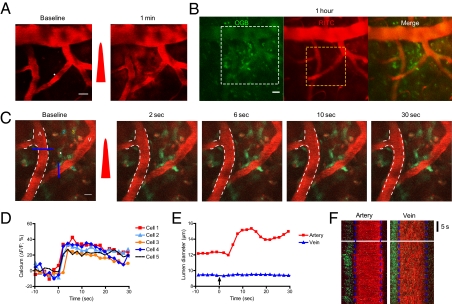
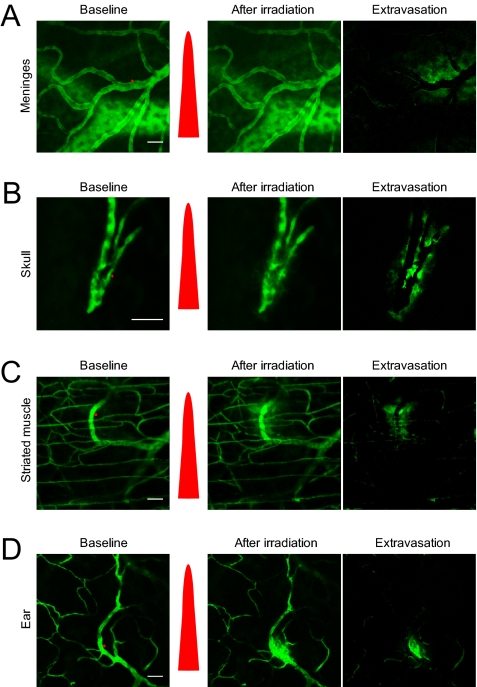
Systemic delivery of bioactive molecules in the CNS is hampered by the blood-brain barrier, which has bottlenecked noninvasive physiological study of the brain and the development of CNS drugs. Here we report that irradiation with an ultrashort pulsed laser to the blood vessel wall induces transient leakage of blood plasma without compromising vascular integrity. By combining this method with a systemic injection, we delivered target molecules in various tissues, including the brain cortex. This tool allows minimally invasive local delivery of chemical probes, nanoparticles, and viral vectors into the brain cortex. Furthermore, we demonstrated astrocyte-mediated vasodilation in vivo without opening the skull, using this method to load a calcium indicator in conjunction with label-free photoactivation of astrocytes.


Conflict of interest statement

The authors declare no conflict of interest.

Figures

Fig. 1.
Fig. 1.
Optical modulation of vascular permeability in the brain. (A) Time-series two-photon laser scanning microscopic images of a cortical vein in the brain. After i.v. injection of 2 MDa of FITC-dextran, the thinned-skull window was imaged with two-photon microscopy. A red dot indicates the position of laser irradiation, and the red pulse indicates laser irradiation. Extravasation images were acquired by subtracting the baseline image. (Scale bar: 50 μm.) (B) Z-projection images obtained at baseline and at 5 min after irradiation. A white rectangle indicates the region of interest in A. (Scale bar: 100 μm.) (C) Regional time kinetics of fluorescence. The regions are indicated by the boxes in A with the corresponding numbers and colors. rfu, relative fluorescence unit. (D and E) Lumen diameter and red blood cell speed were measured before and after inducing extravasation. Red lines show y = x, indicating no change. (F) Extravasation was induced (Upper Right) after measuring the baseline vascular structure using 70-kDa TRITC-dextran (Upper Left). After 10 min, 70-kDa FITC-dextran was injected to evaluate BBB integrity (Lower Left). (Lower Right) Distribution of the two fluorescent probes in the region indicated with a dashed rectangle. (G and H) Extravasation could be repeated by irradiating the laser at the same position. In G, the red dots indicate the region of laser irradiation, and the red pulses indicate laser irradiation. Arrows in H indicate the time of laser irradiation. (Scale bar: 20 μm.) (I) Nissl-stained brains with intact skull, thinned skull, mild laser irradiation targeted on a venule, and severe laser irradiation targeted on arteriole. The red region in the lower right panel indicates a blood clot caused by severe photodamage. (Scale bar: 50 μm.)
Fig. 2.
Fig. 2.
Minimally invasive bulk loading of probes and adenovirus in the brain. (A) Time-course images of bolus dye loading and nuclear staining. Both Hoechst 33342 and 2 MDa FITC-dextran were injected i.v., and extravasation was induced. The red dot indicates the irradiated region. White arrows denote the stained nucleus. (B and C) Time course of intranuclear (solid line circle in A) and extranuclear (dashed line circle in A) FITC-dextran and Hoechst loading. (D) Local nuclear staining in the brain cortex. The image was obtained 30 min after induction of extravasation. Note the clear nuclear staining near the irradiated region (arrows). (Scale bar: 20 μm.) (E) Bolus astrocyte-specific dye loading with laser-induced vascular permeabilization. Both FITC-dextran and SR101 were injected i.v., and extravasation was induced. The red dot indicates the region of laser irradiation; the red pulse indicates laser irradiation. (Scale bar: 20 μm.) (F) Staining of astrocytes in the brain by imaging the same region at 2 h after extravasation. The white dashed box indicates the imaged region in E. White boxes in the lower right image show an enlarged, stained astrocyte. (Scale bar: 50 μm.) (G) Adenoviral gene delivery with laser-induced vascular permeabilization. Here 70-kDa rhodamine-dextran and GFP-adenovirus were injected i.v., and extravasation was induced by laser irradiation at the white dot. (Scale bar: 20 μm.) (H) Adenoviral infection. At 1 d after extravasation, the vasculature and GFP were imaged at the same region. (Scale bar: 20 μm.) (I) A magnified view of the white dotted box in H. (Scale bar: 50 μm.)
Fig. 3.
Fig. 3.
Simultaneous bulk loading of a functional calcium indicator and an astrocyte marker in the brain using laser-induced vascular permeabilization. (A) Z-projected images of the brain stained with a calcium indicator (OGB-1:00 AM) and an astrocyte marker (SR101). Images were obtained at 2 h after delivery. The white dot indicates the region of laser irradiation. V indicates the targeted penetrating venule. White boxes show magnified views of stained cells. Imaging depths from the surface are indicated. (Scale bar: 20 μm.) (B) Spontaneous astrocytic and neuronal calcium activity. Images were obtained at 2 Hz in the region indicated by the dotted circles in A.
Fig. 4.
Fig. 4.
Interrogation of astrocyte-mediated vasodilation in the brain. (A) Oregon Green Bapta-1:00 AM and rhodamine-dextran were injected i.v., and extravasation was induced via femtosecond laser irradiation. The white dot indicates the region of laser irradiation; the red pulse indicates laser irradiation. (Scale bar: 20 μm.) (B) Images were obtained at 1 h after extravasation. The white dotted box indicates the region of interest in A, and the yellow dotted box denotes the region of interest in C. (Scale bar: 20 μm.) (C) Time-series images of vasodilation by photoactivation of astrocytes. The white dot indicates the region of laser stimulation; the red pulse indicates laser irradiation. Note the calcium waves in the targeted and surrounding cells and subsequent vasodilation. The white dotted line demarcates the baseline lumen of the arteriole. The colored numbers indicate the cells used for calcium signal analysis in D. A, artery. V, vein. (Scale bar: 10 μm.) (D) Quantification of calcium signals in the cells and astrocyte endfeet around the artery. (E and F) Temporal kinetics of lumen diameter change in the artery and vein in C. The blue lines in C indicate the region used in F.
Fig. 5.
Fig. 5.
Laser-induced vascular permeabilization in other vessel types. Red dots indicate the region of laser irradiation, and the red pulse indicates laser irradiation. (A) Meningeal vasculature. (B) Skull vasculature. (C) Striated muscle in the dorsal skin. (D) Ear. (Scale bar: 50 μm.)

References

    1. Brightman MW. Morphology of blood–brain interfaces. Exp Eye Res. 1977;25(Suppl):1–25. - PubMed
    1. Pardridge WM. Blood–brain barrier delivery. Drug Discov Today. 2007;12:54–61. - PubMed
    1. Holtmaat A, et al. Long-term, high-resolution imaging in the mouse neocortex through a chronic cranial window. Nat Protoc. 2009;4:1128–1144. - PMC - PubMed
    1. Xu HT, Pan F, Yang G, Gan WB. Choice of cranial window type for in vivo imaging affects dendritic spine turnover in the cortex. Nat Neurosci. 2007;10:549–551. - PubMed
    1. Hanson LR, Frey WH., 2nd Intranasal delivery bypasses the blood–brain barrier to target therapeutic agents to the central nervous system and treat neurodegenerative disease. BMC Neurosci. 2008;9(Suppl 3):S5. - PMC - PubMed

Publication types

LinkOut - more resources