. 2011 May 31;108(22):9020-5.
doi: 10.1073/pnas.1008636108. Epub 2011 May 16.

How social influence can undermine the wisdom of crowd effect

Affiliations

How social influence can undermine the wisdom of crowd effect

Jan Lorenz et al. Proc Natl Acad Sci U S A. .

Abstract

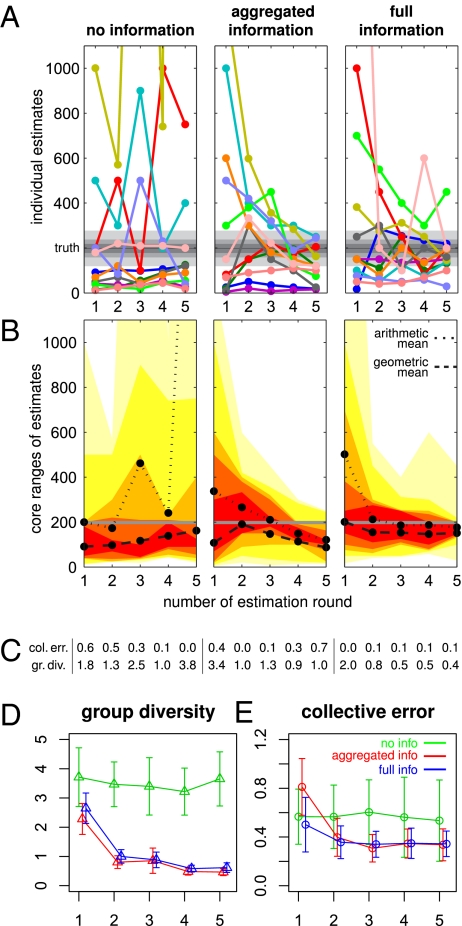
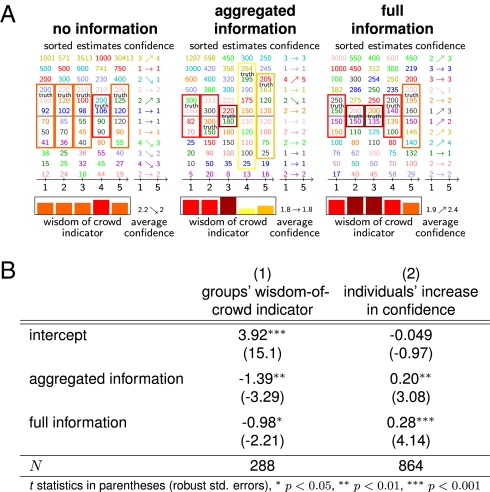
Social groups can be remarkably smart and knowledgeable when their averaged judgements are compared with the judgements of individuals. Already Galton [Galton F (1907) Nature 75:7] found evidence that the median estimate of a group can be more accurate than estimates of experts. This wisdom of crowd effect was recently supported by examples from stock markets, political elections, and quiz shows [Surowiecki J (2004) The Wisdom of Crowds]. In contrast, we demonstrate by experimental evidence (N = 144) that even mild social influence can undermine the wisdom of crowd effect in simple estimation tasks. In the experiment, subjects could reconsider their response to factual questions after having received average or full information of the responses of other subjects. We compare subjects' convergence of estimates and improvements in accuracy over five consecutive estimation periods with a control condition, in which no information about others' responses was provided. Although groups are initially "wise," knowledge about estimates of others narrows the diversity of opinions to such an extent that it undermines the wisdom of crowd effect in three different ways. The "social influence effect" diminishes the diversity of the crowd without improvements of its collective error. The "range reduction effect" moves the position of the truth to peripheral regions of the range of estimates so that the crowd becomes less reliable in providing expertise for external observers. The "confidence effect" boosts individuals' confidence after convergence of their estimates despite lack of improved accuracy. Examples of the revealed mechanism range from misled elites to the recent global financial crisis.


Conflict of interest statement

The authors declare no conflict of interest.

Figures

Fig. 1.
Fig. 1.
Social influence effect: Social influence diminishes group diversity without diminishing the collective error. (A) Typical examples of experimental sessions for all three information conditions, displaying the five individual responses to the question, “How many murders were registered in Switzerland in 2006?” In the no information condition, there is no convergence of estimates, whereas estimates converge in the aggregated and full information conditions. Each subject's decision over the five consecutive responses is represented by a different color. Black lines correspond to the true value; surrounding gray zones represent the areas in which the subjects received monetary payments (payments decrease from dark to light gray). (B) Representation of the same data in aggregated form. The arithmetic mean is represented by a dotted line and the geometric mean by a dashed one. The ranges of the 4, 6, 8, 10, and 12 inner estimates are represented by red, dark orange, light orange, dark yellow, and light yellow colors. (C) Values of the collective error (squared deviation of group average from the truth) and group diversity (average squared deviation from the group average) for all 12 estimates at each time step for the same exemplary session as in A and B (computed on logarithms of the estimates and normalized by true values). (D) Average group diversity for all information conditions over time (each data point represents 24 groups, aggregated over all questions; computed on logarithms of estimates and normalized by the respective true value; error-bars represent 10% confidence intervals). (E) Average collective error (data and presentation analogous to D).
Fig. 2.
Fig. 2.
Although the wisdom of the crowd diminishes over time, individuals gain confidence in their own estimates. (A) Sorted estimates over successive rounds for the same exemplary sessions as displayed in Fig. 1. Boxes represent the most inner estimates that still include the true value. The range of the box depicts the wisdom-of-crowd indicator. The maximum value of 6 represents the highest value for the wisdom of the crowd meaning, that 6 values are below and 6 above the true value. A wisdom-of-crowd indicator of 0 denotes that the truth is outside of the range of estimates. The colors of the boxes and bars for the wisdom-of-crowd indicator are analogous to B (for values 0–5, aubergine is additionally introduced for the value of 6). Colored numbers represent individuals (analogous to colors in Fig. 1A). The right column shows the certainty of the estimate as reported by the respective individual after estimate 1 and estimate 5 (1, very uncertain; 6, very certain). These values were not propagated to other subjects. (B) Confirmation of exemplary trends by regression models taking all questions into account. Linear regressions on (model 1) the groups’ wisdom-of-crowd indicator and (model 2) individuals’ change in the certainty of their estimates. The predictors in both models are the experimental treatments, implemented as dummy variables and coded with 1 as the experimental condition (aggregated or full information) and 0 otherwise. The control condition is the reference category, represented by the intercept of the respective regression model. In model 1, the wisdom-of-crowd indicator is calculated for the pooled second, third, fourth, and fifth time step. The first time step is excluded because the initial period had no information feedback and can therefore not yield treatment differences. In model 2, individuals’ increase in confidence is the outcome variable, which is the difference between the initial and final individuals’ certainty in their estimates. Robust SEs are calculated, taking the clustering within subjects into account.

Comment in

References

    1. Galton F. Vox populi. Nature. 1907;75:7.
    1. Lorge I, Fox D, Davitz J, Brenner M. A survey of studies contrasting the quality of group performance and individual performance, 1920-1957. Psychol Bull. 1958;55:337–372. - PubMed
    1. Hommes C, Sonnenmans J, Tuinstra J, van de Velden H. Coordination of expectations in asset pricing experiments. Rev Financial Stud. 2005;18:955–980.
    1. Yaniv I, Milyavsky M. Using advice from multiple sources to revise and improve judgments. Organization Behav Hum Decis Process. 2007;103:104–120.
    1. Surowiecki J. The Wisdom of Crowds: Why the Many Are Smarter than the Few and How Collective Wisdom Shapes Business, Economies, Societies, and Nations. New York: Doubleday Books; 2004.

Publication types