. 2011 May 31;108(22):8943-8.
doi: 10.1073/pnas.1014501108. Epub 2011 May 16.

Deep-tissue anatomical imaging of mice using carbon nanotube fluorophores in the second near-infrared window

Affiliations

Deep-tissue anatomical imaging of mice using carbon nanotube fluorophores in the second near-infrared window

Kevin Welsher et al. Proc Natl Acad Sci U S A. .

Abstract

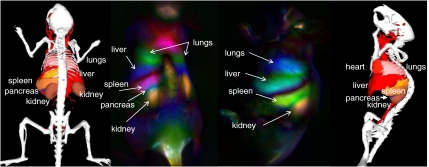
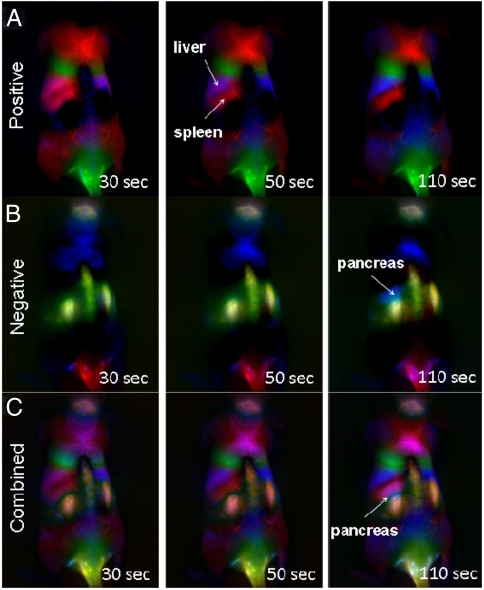
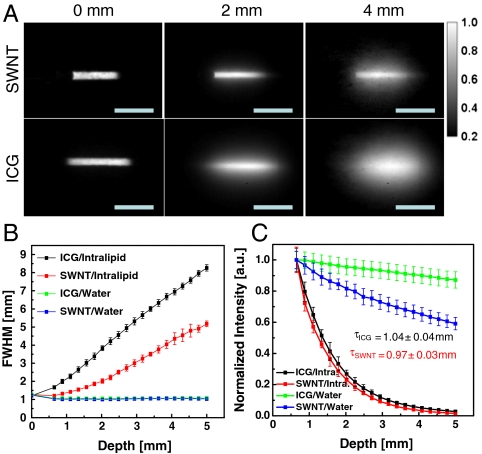
Fluorescent imaging in the second near-infrared window (NIR II, 1-1.4 μm) holds much promise due to minimal autofluorescence and tissue scattering. Here, using well-functionalized biocompatible single-walled carbon nanotubes (SWNTs) as NIR II fluorescent imaging agents, we performed high-frame-rate video imaging of mice during intravenous injection of SWNTs and investigated the path of SWNTs through the mouse anatomy. We observed in real-time SWNT circulation through the lungs and kidneys several seconds postinjection, and spleen and liver at slightly later time points. Dynamic contrast-enhanced imaging through principal component analysis (PCA) was performed and found to greatly increase the anatomical resolution of organs as a function of time postinjection. Importantly, PCA was able to discriminate organs such as the pancreas, which could not be resolved from real-time raw images. Tissue phantom studies were performed to compare imaging in the NIR II region to the traditional NIR I biological transparency window (700-900 nm). Examination of the feature sizes of a common NIR I dye (indocyanine green) showed a more rapid loss of feature contrast and integrity with increasing feature depth as compared to SWNTs in the NIR II region. The effects of increased scattering in the NIR I versus NIR II region were confirmed by Monte Carlo simulation. In vivo fluorescence imaging in the NIR II region combined with PCA analysis may represent a powerful approach to high-resolution optical imaging through deep tissues, useful for a wide range of applications from biomedical research to disease diagnostics.


Conflict of interest statement

The authors declare no conflict of interest.

Figures

Fig. 1.
Fig. 1.
NIR II imaging. (A) Schematic of NIR II imaging setup. Anaesthetized mice are illuminated from above with 808-nm light. NIR fluorescence (1,100–1,700 nm) is filtered and imaged onto a 2D InGaAs array. (B) Fluorescence spectrum of biocompatible DSPE-mPEG functionalized SWNTs excited at 808 nm, showing several emission peaks spanning the NIR II region. (C) Absorption coefficient, μa, of water, showing the increased absorption of water in the NIR II compared to the NIR I. (D) Reduced scattering coefficient, formula image
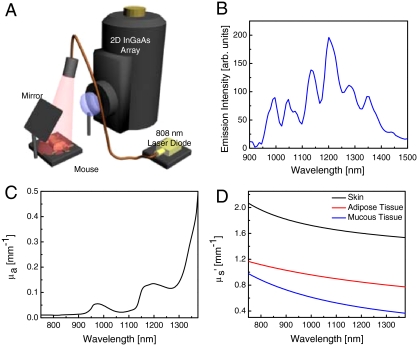
, for skin, adipose tissue and mucous tissue as derived in ref. , all showing decreased scattering with increasing wavelength.
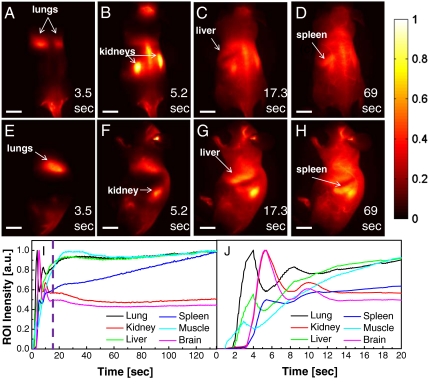
Fig. 2.
Fig. 2.
Video-rate imaging of SWNTs in a live mouse. Frames from video imaging of mice injected with SWNTs. At (A and E) 3.5 s following tail-vein injection, the lungs are the dominant feature, corresponding to flow of the oxygen-poor, SWNT-rich blood to the lungs. (B and F) At 5.2 s, the SWNT-rich blood flows through the highly vascularized kidney. (C and G) The liver becomes apparent at 17.3 s p.i., whereas the (D and H) spleen becomes visible at 69 s p.i.. Scale bars in all images represent 1 cm. (I and J) Normalized ROI time courses over the organs in the raw images. For clarity, frames where the mouse is breathing were not included. The lungs, kidney, and liver show large spikes shortly after injection (approximately 5 s) followed by a return to a steady-state intensity within 20 s. The purple line in I shows the predicted time for blood to make one pass through the body, leading to a steady-state SWNT signal in the body. The spleen shows a deviation from this behavior, showing no early spike and a monotonic increase in signal with increasing time.
Fig. 3.
Fig. 3.
Dynamic contrast-enhanced imaging with SWNTs through PCA. PCA images taken over the first 130 s following injection performed by taking every 150 evenly spaced frames out of the 2,000-frame dataset. Major features observed belong to the lungs, liver, kidney, and spleen. Of note is the appearance of the pancreas in the interstitial space between the kidney and spleen (see text for details). This feature is not observable in the raw time-course images.
Fig. 4.
Fig. 4.
Time-dependent PCA images of mouse anatomy with SWNTs. (A) Positive pixels of time-dependent PCA, showing the liver and spleen of the RES. The liver and spleen show increasing clarity as a function of time. (B) Negative pixels from time-dependent PCA showing kidney features at 30, 50, and 110 s. The pancreas appears as a blue spot above the left kidney in the 110-s image. (C) Absolute value of pixels from time-dependent PCA analysis, showing increased clarity of liver and spleen as a function of time and a distinct blue pancreas feature at 110 s.
Fig. 5.
Fig. 5.
Tissue phantom study of the depth penetration of SWNTs and ICG. (A) Fluorescence images of capillaries of SWNTs (NIR II) and ICG (NIR I) at depths of 0, 3, and 5 mm in Intralipid® excited at 785 nm. The SWNT sample shows less feature spread than that of the ICG sample. Scale bars represent 1.5 cm. (B) Feature width of SWNT and ICG capillary images as a function of depth in Intralipid®, showing increased loss of feature integrity for the NIR I–emitting ICG compared to the NIR II–emitting SWNT. Control experiments performed in water show no change in feature size for both ICG and SWNT. Error bars are derived from the uncertainty in the fitting of feature width. (C) Intensity decay of ICG and SWNT as a function of depth in Intralipid® and water. Despite the greater absorption of water in NIR II, the decay of signal in the Intralipid® phantom is similar for both ICG and SWNT, showing exponential decay depths of 1.04 ± 0.04 and 0.97 ± 0.03 mm respectively.

References

    1. Lakowicz JR. Principles of Fluorescence Spectroscopy. New York: Springer; 2006.
    1. Rust MJ, Bates M, Zhuang X. Sub-diffraction-limit imaging by stochastic optical reconstruction microscopy (STORM) Nat Methods. 2006;3:793–795. - PMC - PubMed
    1. Betzig E, et al. Imaging intracellular fluorescent proteins at nanometer resolution. Science. 2006;313:1642–1645. - PubMed
    1. Splinter R, Hooper BA. An Introduction to Biomedical Optics. New York: Taylor & Francis; 2007.
    1. Britton C. Near-infrared images using continuous, phase-modulated, and pulsed light with quantitation of blood and blood oxygenation. Ann N Y Acad Sci. 1998;838:29–45. - PubMed

Publication types