Committed sea-level rise for the next century from Greenland ice sheet dynamics during the past decade
- PMID: 21576500
- PMCID: PMC3107304
- DOI: 10.1073/pnas.1017313108
Committed sea-level rise for the next century from Greenland ice sheet dynamics during the past decade
Abstract
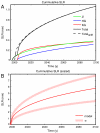
We use a three-dimensional, higher-order ice flow model and a realistic initial condition to simulate dynamic perturbations to the Greenland ice sheet during the last decade and to assess their contribution to sea level by 2100. Starting from our initial condition, we apply a time series of observationally constrained dynamic perturbations at the marine termini of Greenland's three largest outlet glaciers, Jakobshavn Isbræ, Helheim Glacier, and Kangerdlugssuaq Glacier. The initial and long-term diffusive thinning within each glacier catchment is then integrated spatially and temporally to calculate a minimum sea-level contribution of approximately 1 ± 0.4 mm from these three glaciers by 2100. Based on scaling arguments, we extend our modeling to all of Greenland and estimate a minimum dynamic sea-level contribution of approximately 6 ± 2 mm by 2100. This estimate of committed sea-level rise is a minimum because it ignores mass loss due to future changes in ice sheet dynamics or surface mass balance. Importantly, > 75% of this value is from the long-term, diffusive response of the ice sheet, suggesting that the majority of sea-level rise from Greenland dynamics during the past decade is yet to come. Assuming similar and recurring forcing in future decades and a self-similar ice dynamical response, we estimate an upper bound of 45 mm of sea-level rise from Greenland dynamics by 2100. These estimates are constrained by recent observations of dynamic mass loss in Greenland and by realistic model behavior that accounts for both the long-term cumulative mass loss and its decay following episodic boundary forcing.
Conflict of interest statement
The authors declare no conflict of interest.
Figures


References
-
- Solomon SD, et al., editors. Contribution of Working Group I to the Fourth Assessment Report of the Intergovernmental Panel on Climate Change. Cambridge, UK: Cambridge Univ Press; 2007. Climate change 2007: The physical science basis.
-
- Little CM, et al. Toward a new generation of ice sheet models. EOS. 2007;88:578–579.
-
- Lipscomb L, et al. A community ice sheet model for sea level predition. EOS. 2009;90:23.
-
- Meier MF, et al. Glaciers dominate Eustatic sea-level rise in the 21st century. Science. 2007;317:1064–1067. - PubMed
-
- Pfeffer WT, Harper JT, O’neel S. Kinematic constraints on glacier contributions to 21st-century sea-level rise. Science. 2008;321:1340–1343. - PubMed
Publication types
MeSH terms
Substances
LinkOut - more resources
Full Text Sources
Miscellaneous

