Randomized Controlled Trial
. 2011 May 31;123(21):2353-62.
doi: 10.1161/CIRCULATIONAHA.110.004341. Epub 2011 May 16.

Renin-angiotensin-aldosterone genotype influences ventricular remodeling in infants with single ventricle

Collaborators, Affiliations
Randomized Controlled Trial

Renin-angiotensin-aldosterone genotype influences ventricular remodeling in infants with single ventricle

Seema Mital et al. Circulation. .

Abstract

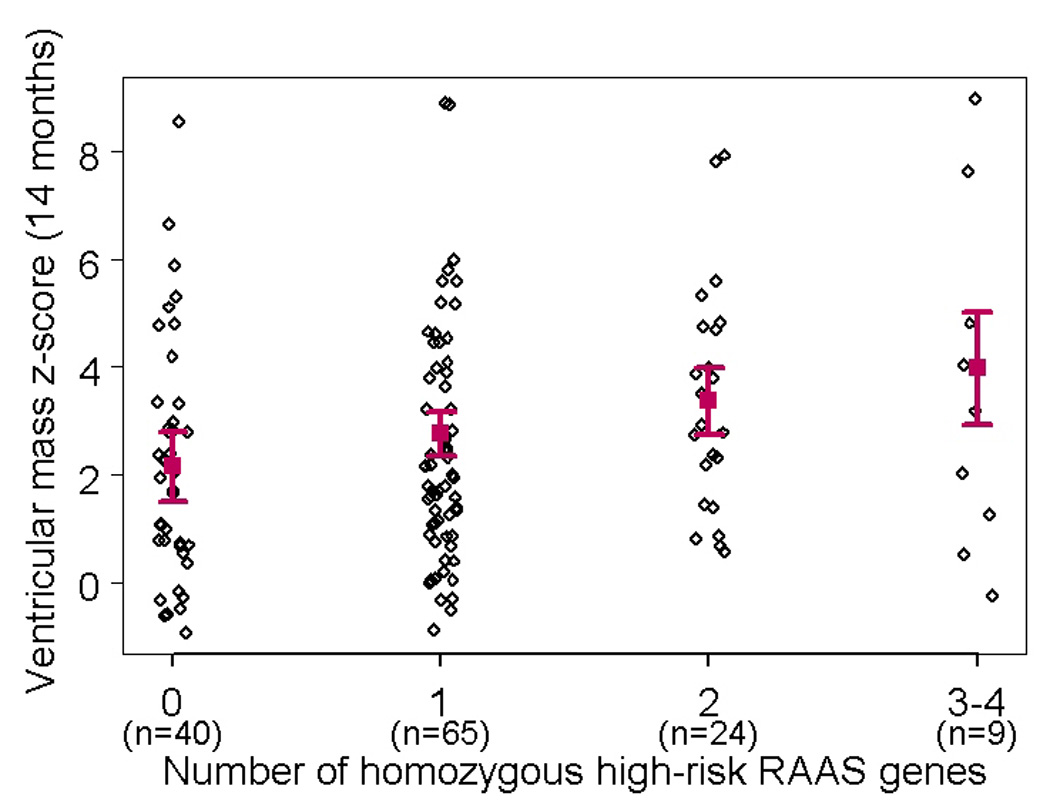
Background: We investigated the effect of polymorphisms in the renin-angiotensin-aldosterone system (RAAS) genes on ventricular remodeling, growth, renal function, and response to enalapril in infants with single ventricle.

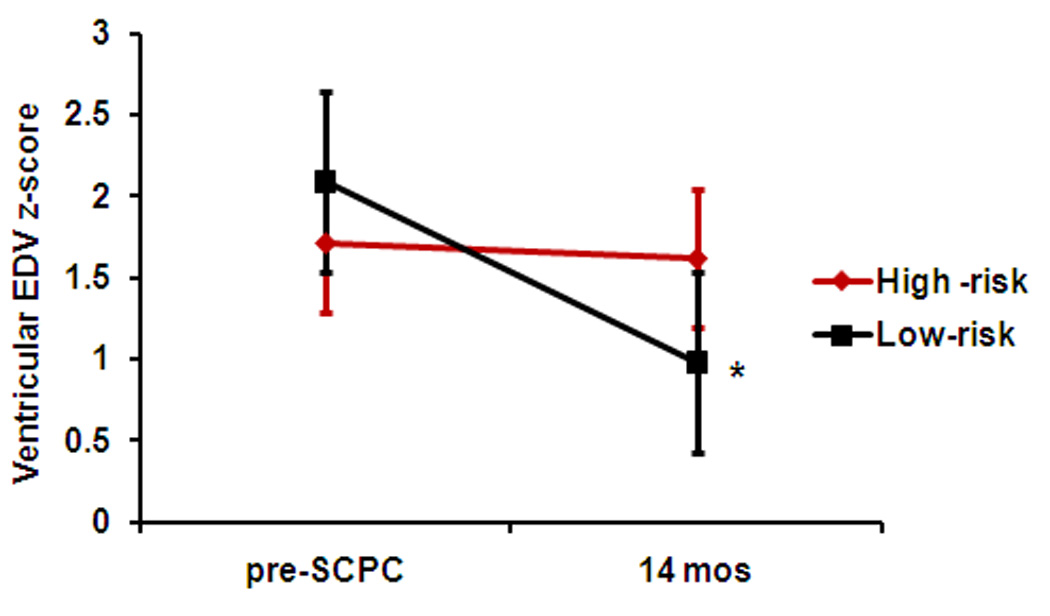
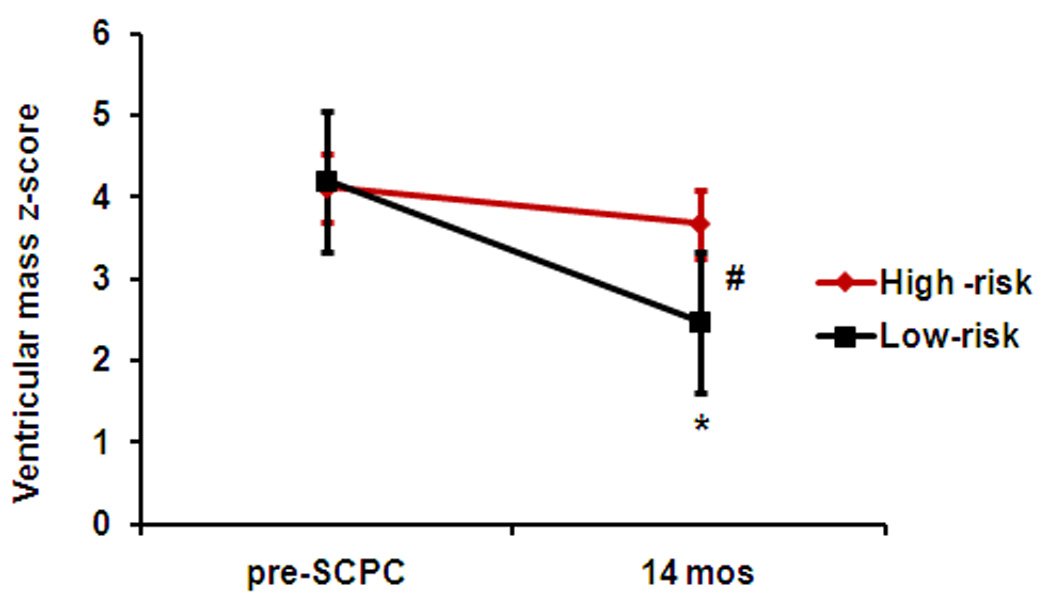
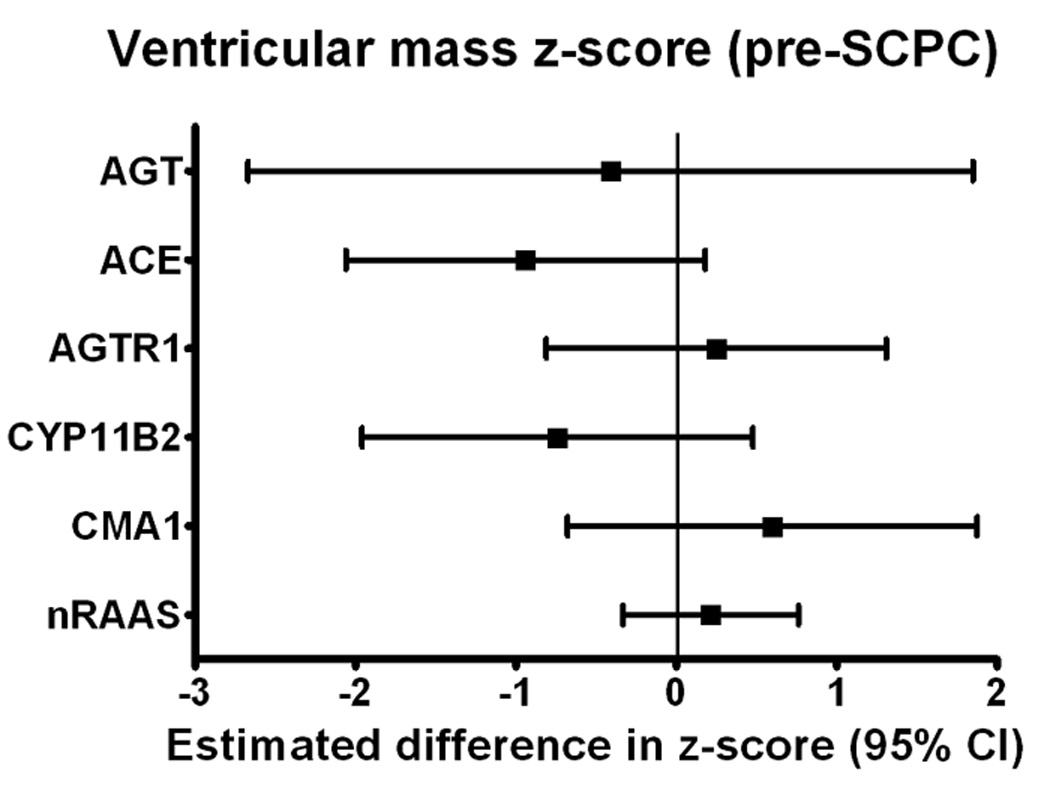
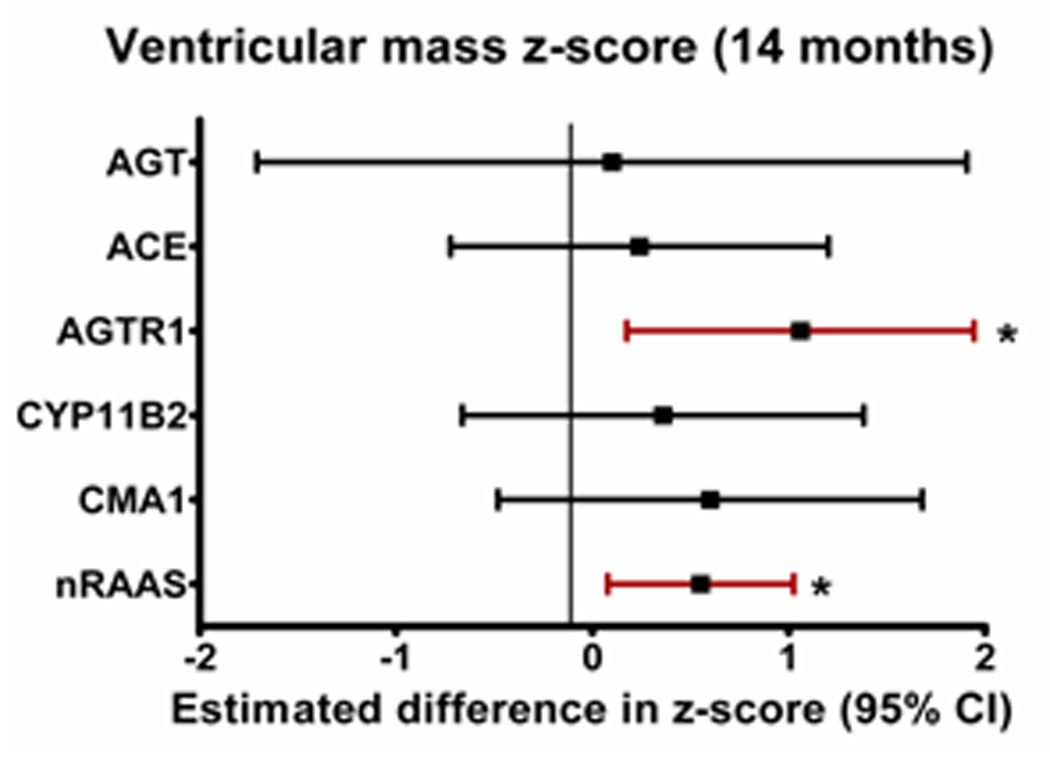
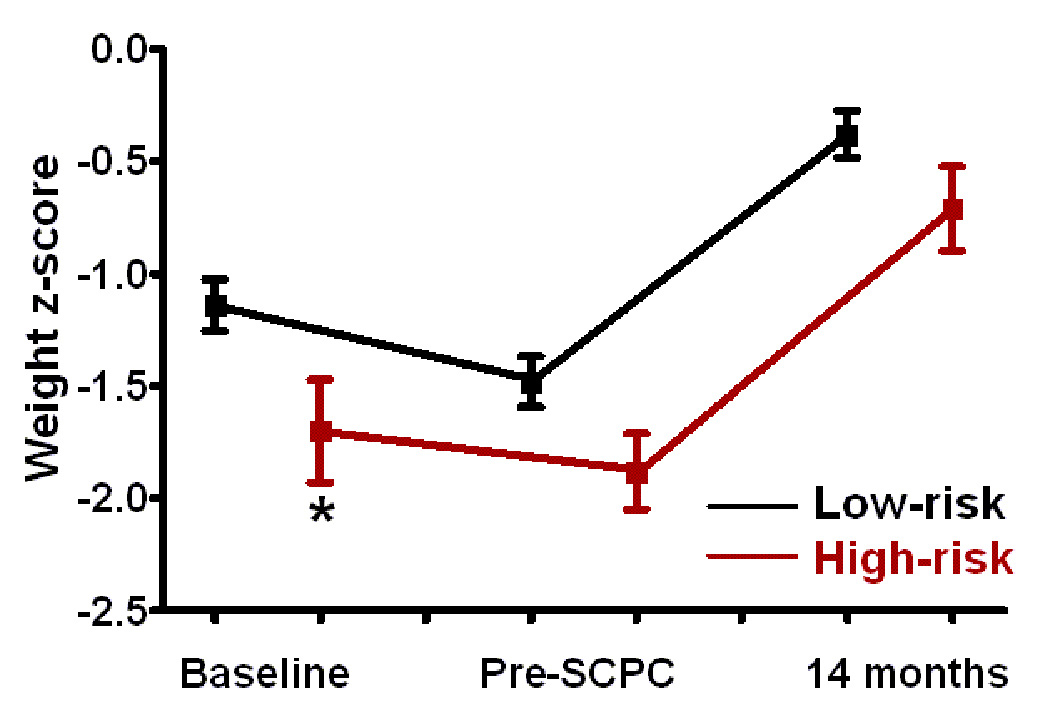
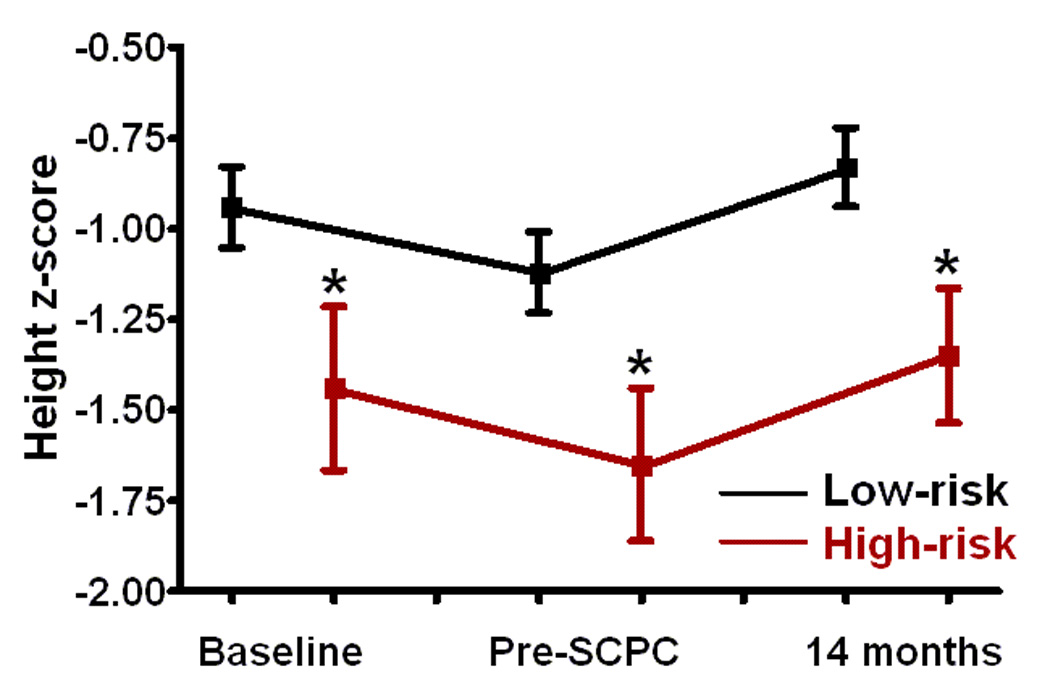
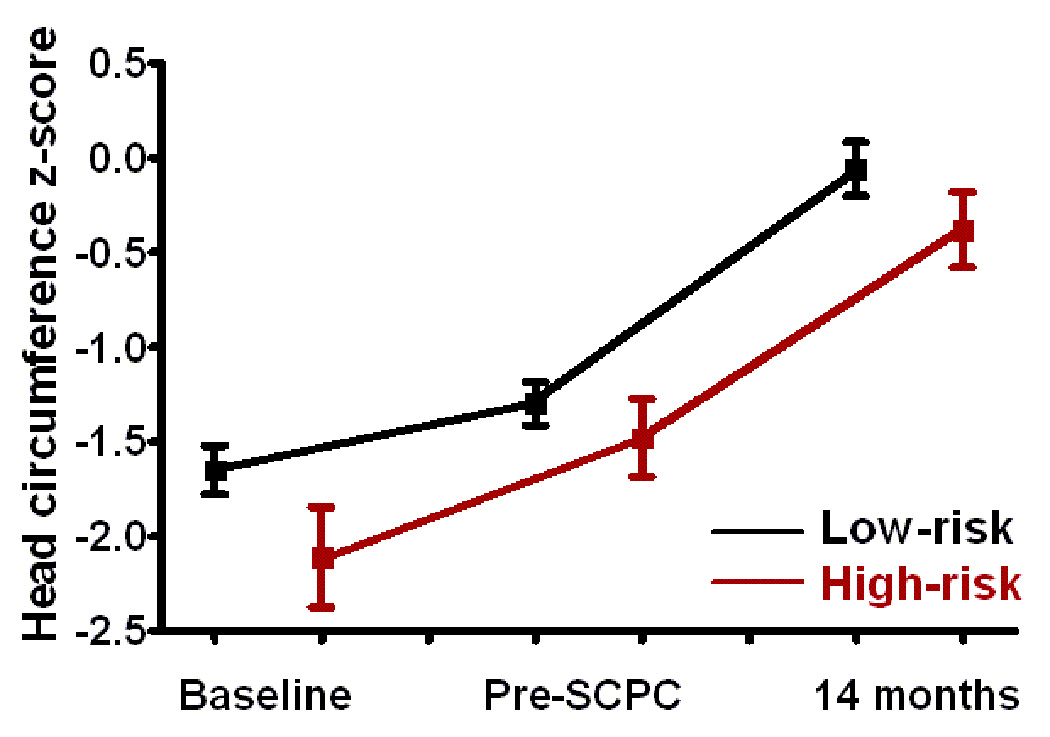
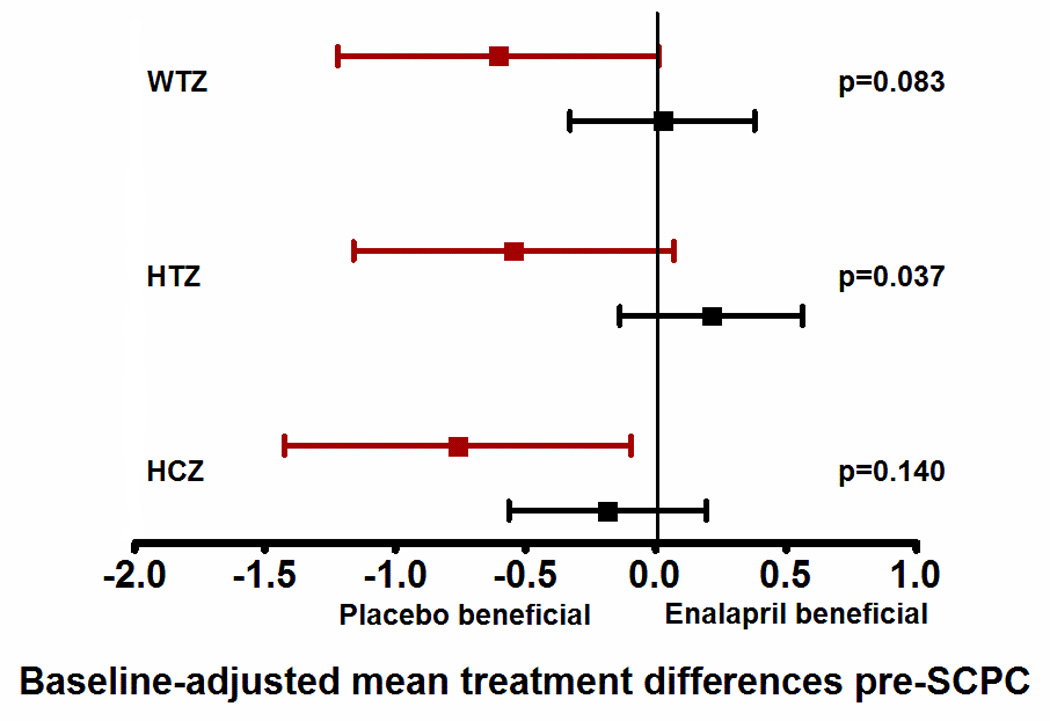
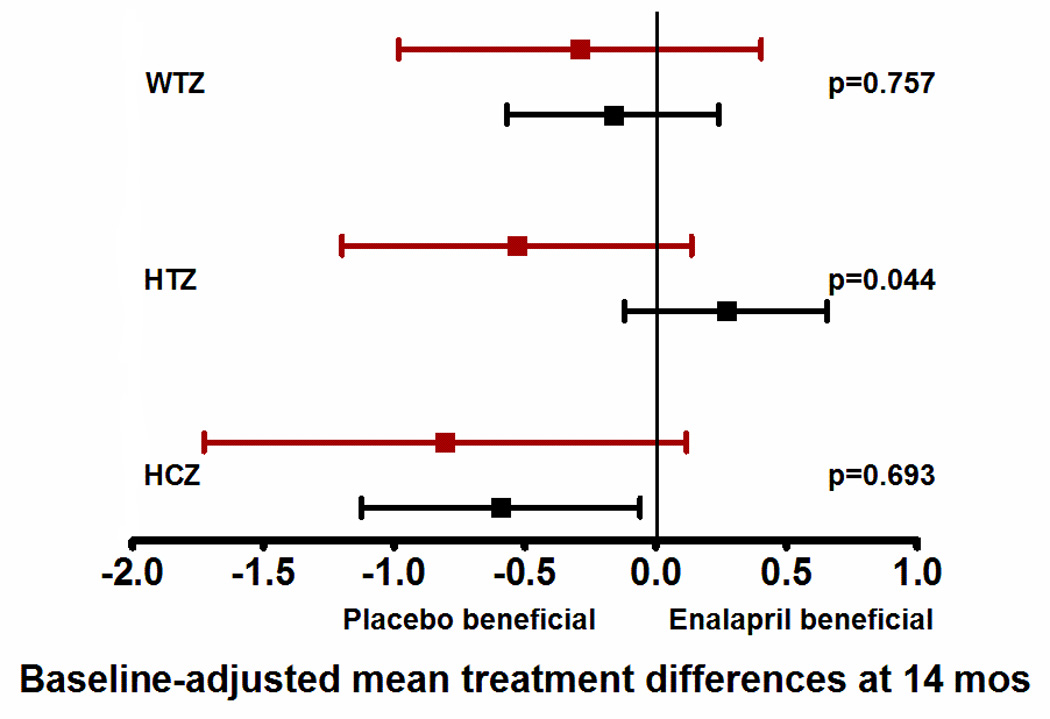
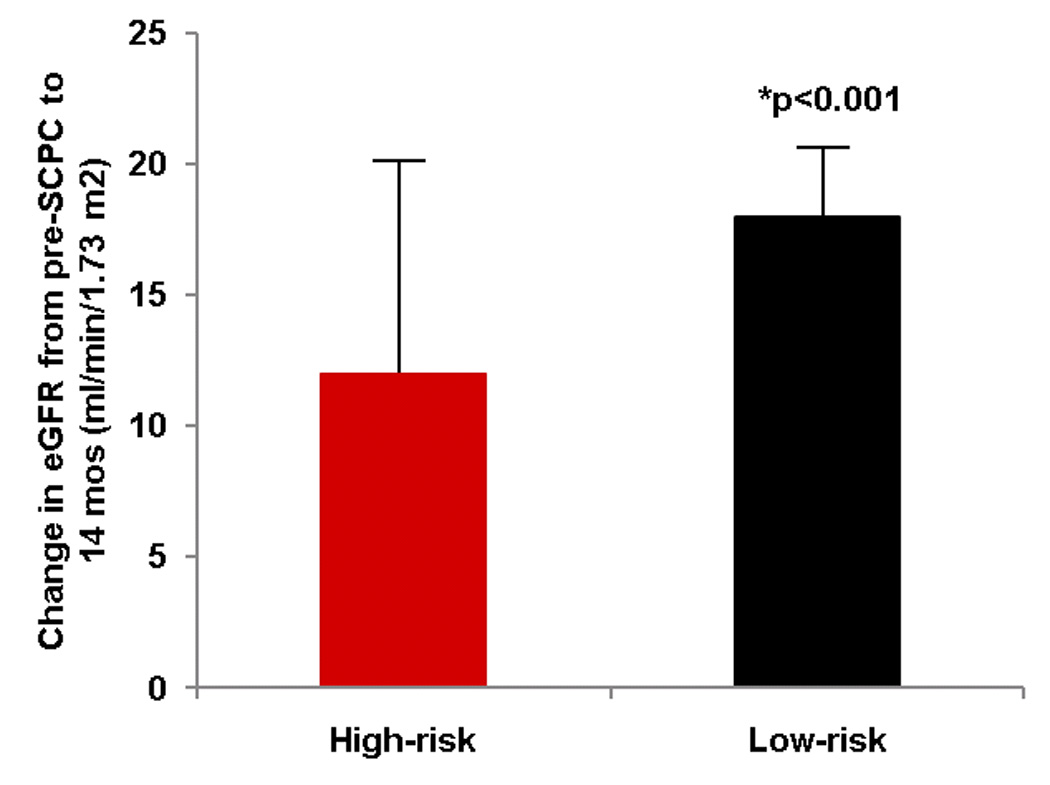
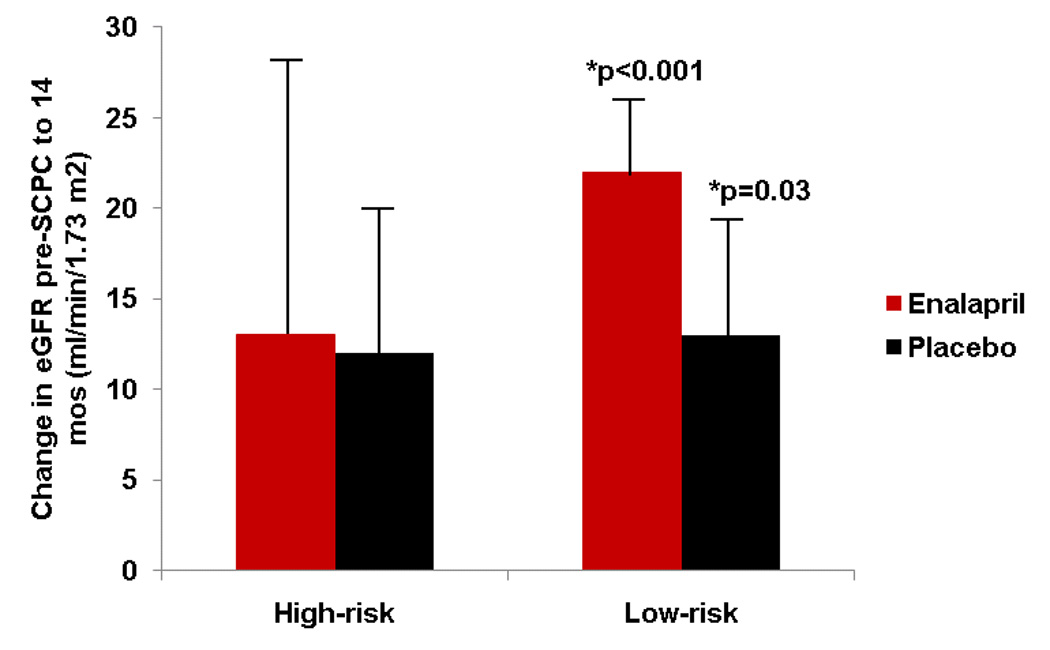
Methods and results: Single ventricle infants enrolled in a randomized trial of enalapril were genotyped for polymorphisms in 5 genes: angiotensinogen, angiotensin-converting enzyme, angiotensin II type 1 receptor, aldosterone synthase, and chymase. Alleles associated with renin-angiotensin-aldosterone system upregulation were classified as risk alleles. Ventricular mass, volume, somatic growth, renal function using estimated glomerular filtration rate, and response to enalapril were compared between patients with ≥2 homozygous risk genotypes (high risk), and those with <2 homozygous risk genotypes (low risk) at 2 time points: before the superior cavopulmonary connection (pre-SCPC) and at age 14 months. Of 230 trial subjects, 154 were genotyped: Thirty-eight were high risk, and 116 were low risk. Ventricular mass and volume were elevated in both groups pre-SCPC. Ventricular mass and volume decreased and estimated glomerular filtration rate increased after SCPC in the low-risk (P<0.05), but not the high-risk group. These responses were independent of enalapril treatment. Weight and height z-scores were lower at baseline, and height remained lower in the high-risk group at 14 months, especially in those receiving enalapril (P<0.05).

Conclusions: Renin-angiotensin-aldosterone system-upregulation genotypes were associated with failure of reverse remodeling after SCPC surgery, less improvement in renal function, and impaired somatic growth, the latter especially in patients receiving enalapril. Renin-angiotensin-aldosterone system genotype may identify a high-risk subgroup of single ventricle patients who fail to fully benefit from volume-unloading surgery. Follow-up is warranted to assess long-term impact.

Clinical trial registration: http://www.clinicaltrials.gov. Unique identifier: NCT00113087.


Figures

Figure 1
Figure 1
(a) Ventricular EDV z-scores, and (b) Ventricular mass z-scores decreased in the low-risk (black, n=116) but not in the high-risk (red, n=38) genotype groups from pre-SCPC to final study visit. High-risk, ≥ 2 homozygous risk genotypes; Low-risk, < 2 homozygous risk genotypes. *p<0.05 from pre-SCPC; # p<0.05 from low-risk group at 14 months. SCPC = superior cavopulmonary connection; EDV = end-diastolic volume
Figure 1
Figure 1
(a) Ventricular EDV z-scores, and (b) Ventricular mass z-scores decreased in the low-risk (black, n=116) but not in the high-risk (red, n=38) genotype groups from pre-SCPC to final study visit. High-risk, ≥ 2 homozygous risk genotypes; Low-risk, < 2 homozygous risk genotypes. *p<0.05 from pre-SCPC; # p<0.05 from low-risk group at 14 months. SCPC = superior cavopulmonary connection; EDV = end-diastolic volume
Figure 2
Figure 2
Difference (and 95% confidence intervals) in ventricular mass z-scores at (a) pre-SCPC and (b) final study visit between individual risk genotypes (high-risk minus no high-risk) using recessive model (*p<0.05 vs low risk genotype) showing a trend towards higher mass z-scores at 14 months in patients with high-risk genotypes with strongest association with AGTR1. (c) Linear regression model (mean± 95% confidence limits) showing incremental effect of increasing number of RAAS-upregulation genotypes on ventricular mass z-score at 14 months. 3 cases with mass z-scores outside the extreme physiologic range were excluded. AGT = Angiotensinogen; ACE = Angiotensin converting enzyme; AGTR1 = Angiotensin II type 1 receptor; CYP11B2 = Aldosterone synthase; CMA1 = Chymase; nRAAS = total number of high risk renin-angiotensin-aldosterone system genotypes; SCPC = superior cavopulmonary connection
Figure 2
Figure 2
Difference (and 95% confidence intervals) in ventricular mass z-scores at (a) pre-SCPC and (b) final study visit between individual risk genotypes (high-risk minus no high-risk) using recessive model (*p<0.05 vs low risk genotype) showing a trend towards higher mass z-scores at 14 months in patients with high-risk genotypes with strongest association with AGTR1. (c) Linear regression model (mean± 95% confidence limits) showing incremental effect of increasing number of RAAS-upregulation genotypes on ventricular mass z-score at 14 months. 3 cases with mass z-scores outside the extreme physiologic range were excluded. AGT = Angiotensinogen; ACE = Angiotensin converting enzyme; AGTR1 = Angiotensin II type 1 receptor; CYP11B2 = Aldosterone synthase; CMA1 = Chymase; nRAAS = total number of high risk renin-angiotensin-aldosterone system genotypes; SCPC = superior cavopulmonary connection
Figure 3
Figure 3
(a) Weight, (b) height, and (c) head circumference z-scores at baseline i.e. enrollment, pre-SCPC and final study visit by genotype; Low-risk (black, n=116); high-risk (red, n=38). The offset at the different time points between the genotype groups is for better visualization of standard errors. Squares = mean value; whiskers = standard error. * p<0.05 from low risk group. SCPC = Superior cavopulmonary connection
Figure 3
Figure 3
(a) Weight, (b) height, and (c) head circumference z-scores at baseline i.e. enrollment, pre-SCPC and final study visit by genotype; Low-risk (black, n=116); high-risk (red, n=38). The offset at the different time points between the genotype groups is for better visualization of standard errors. Squares = mean value; whiskers = standard error. * p<0.05 from low risk group. SCPC = Superior cavopulmonary connection
Figure 4
Figure 4
This figure shows the differences in growth z-scores between the enalapril and placebo treated patients in the two risk groups (high-risk shown in red, and low-risk shown in black) at two time points - at pre-SCPC and final study visits. Data are shown as mean and 95% confidence intervals, adjusted for baseline z-scores. Mean values to the left of zero indicate lower z-scores in enalapril-treated patients i.e. placebo-beneficial; mean values to the right of zero indicate higher z-scores in the enalapril-treated patients i.e enalapril-beneficial. The interaction p values represent the differences in treatment effect between the high and low risk groups. There was no treatment effect on weight, height or head circumference in the low-risk group (black) at pre-SCPC (panel a), and at 14 months (panel b). However, high-risk patients (red) receiving enalapril had lower height z-scores at pre-SCPC, and at 14 months compared to placebo group. n=63, enalapril-treated low risk; n=53, placebo-treated low risk; n=18, enalapril-treated high risk; n=20, placebo-treated high risk. *p<0.05 enalapril vs placebo. SCPC = Superior cavopulmonary connection, WTZ = weight z-score; HTZ = height z-score; HCZ = head circumference z-score.
Figure 4
Figure 4
This figure shows the differences in growth z-scores between the enalapril and placebo treated patients in the two risk groups (high-risk shown in red, and low-risk shown in black) at two time points - at pre-SCPC and final study visits. Data are shown as mean and 95% confidence intervals, adjusted for baseline z-scores. Mean values to the left of zero indicate lower z-scores in enalapril-treated patients i.e. placebo-beneficial; mean values to the right of zero indicate higher z-scores in the enalapril-treated patients i.e enalapril-beneficial. The interaction p values represent the differences in treatment effect between the high and low risk groups. There was no treatment effect on weight, height or head circumference in the low-risk group (black) at pre-SCPC (panel a), and at 14 months (panel b). However, high-risk patients (red) receiving enalapril had lower height z-scores at pre-SCPC, and at 14 months compared to placebo group. n=63, enalapril-treated low risk; n=53, placebo-treated low risk; n=18, enalapril-treated high risk; n=20, placebo-treated high risk. *p<0.05 enalapril vs placebo. SCPC = Superior cavopulmonary connection, WTZ = weight z-score; HTZ = height z-score; HCZ = head circumference z-score.
Figure 5
Figure 5
(a) Mean change ± standard error in estimated glomerular filtration rate (eGFR) (14 months minus pre-SCPC). eGFR increased in the low-risk (black, n=85) but not in the high-risk group (red, n=26); *p<0.05 for change score from pre-SCPC. (b) The increase in eGFR in the low-risk group was independent of treatment with enalapril (red) versus placebo (black). High-risk/enalapril = 11; high-risk/placebo 15, low-risk/enalapril = 48; low risk/placebo = 37. *p<0.05 for change score from pre-SCPC. SCPC = Superior cavopulmonary connection; eGFR = estimated glomerular filtration rate
Figure 5
Figure 5
(a) Mean change ± standard error in estimated glomerular filtration rate (eGFR) (14 months minus pre-SCPC). eGFR increased in the low-risk (black, n=85) but not in the high-risk group (red, n=26); *p<0.05 for change score from pre-SCPC. (b) The increase in eGFR in the low-risk group was independent of treatment with enalapril (red) versus placebo (black). High-risk/enalapril = 11; high-risk/placebo 15, low-risk/enalapril = 48; low risk/placebo = 37. *p<0.05 for change score from pre-SCPC. SCPC = Superior cavopulmonary connection; eGFR = estimated glomerular filtration rate

References

    1. Steinberger EK, Ferencz C, Loffredo CA. Infants with single ventricle: A population-based epidemiological study. Teratology. 2002;65:106–115. - PubMed
    1. Allgood NL, Alejos J, Drinkwater DC, Laks H, Williams RG. Effectiveness of the bidirectional glenn shunt procedure for volume unloading in the single ventricle patient. Am J Cardiol. 1994;74:834–836. - PubMed
    1. Gewillig MH, Lundstrom UR, Deanfield JE, Bull C, Franklin RC, Graham TP, Jr, Wyse RK. Impact of fontan operation on left ventricular size and contractility in tricuspid atresia. Circulation. 1990;81:118–127. - PubMed
    1. Cheung YF, Penny DJ, Redington AN. Serial assessment of left ventricular diastolic function after fontan procedure. Heart. 2000;83:420–424. - PMC - PubMed
    1. Gentles TL, Mayer JE, Jr, Gauvreau K, Newburger JW, Lock JE, Kupferschmid JP, Burnett J, Jonas RA, Castaneda AR, Wernovsky G. Fontan operation in five hundred consecutive patients: Factors influencing early and late outcome. J Thorac Cardiovasc Surg. 1997;114:376–391. - PubMed

Publication types

MeSH terms

Associated data