. 2011 Jun;121(6):2264-77.
doi: 10.1172/JCI43157. Epub 2011 May 16.

Repeated TLR9 stimulation results in macrophage activation syndrome-like disease in mice

Affiliations

Repeated TLR9 stimulation results in macrophage activation syndrome-like disease in mice

Edward M Behrens et al. J Clin Invest. 2011 Jun.

Abstract

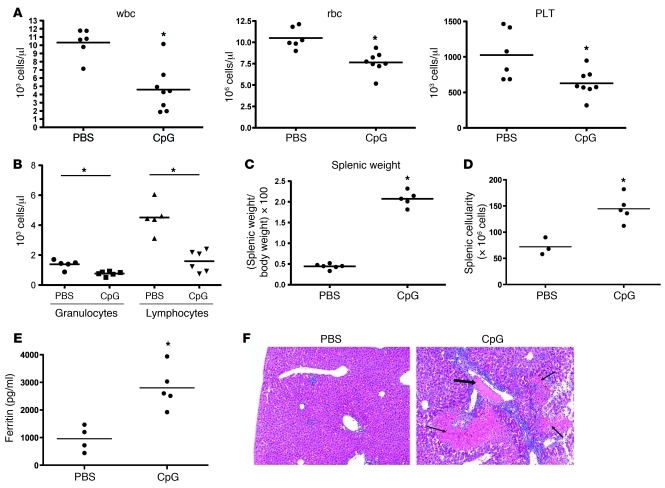
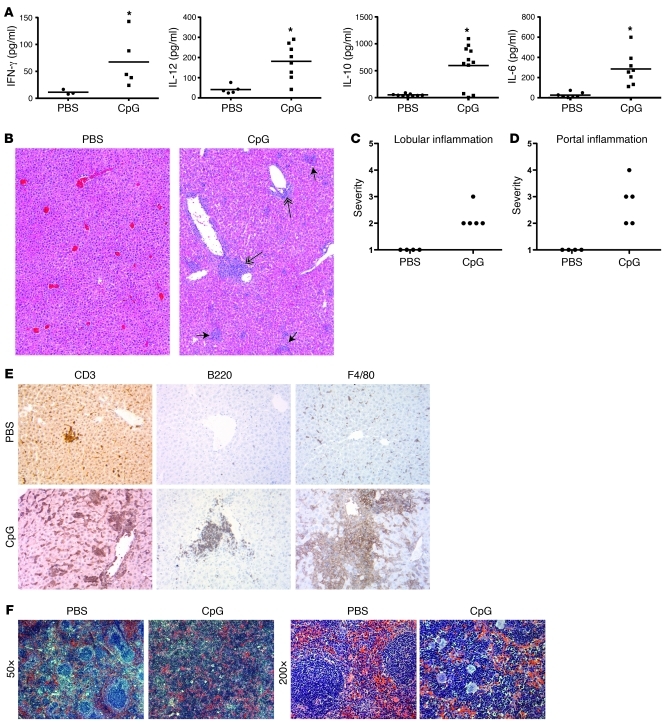
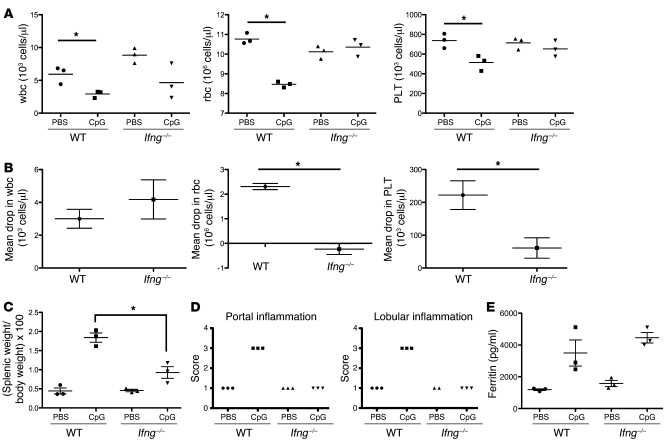
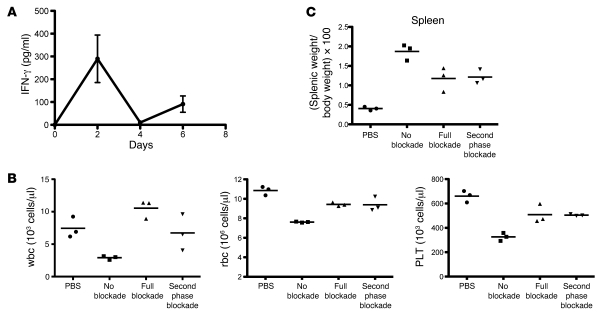
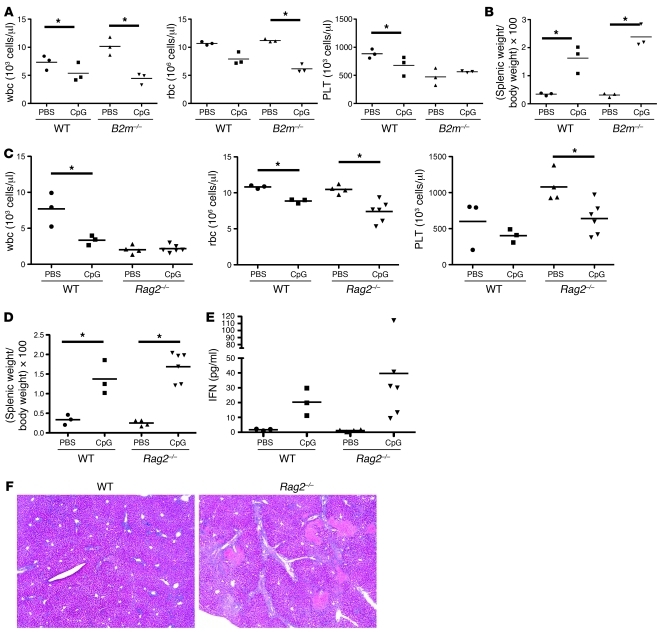
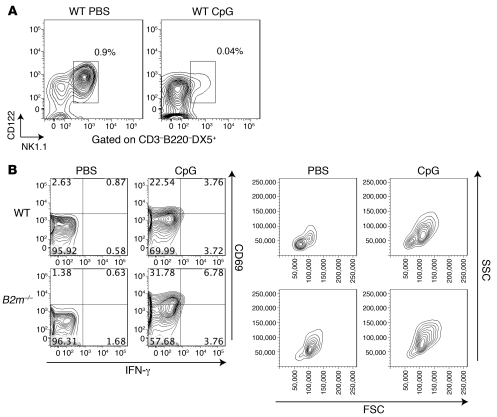
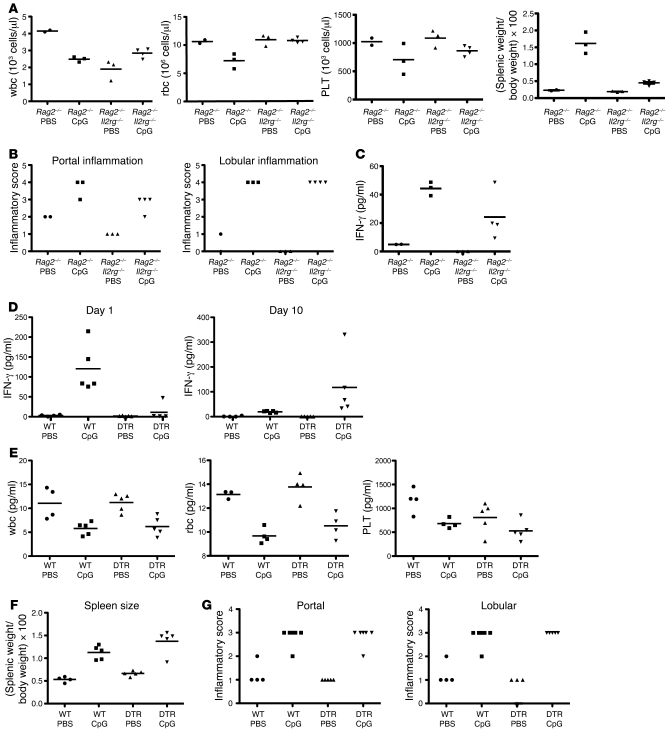
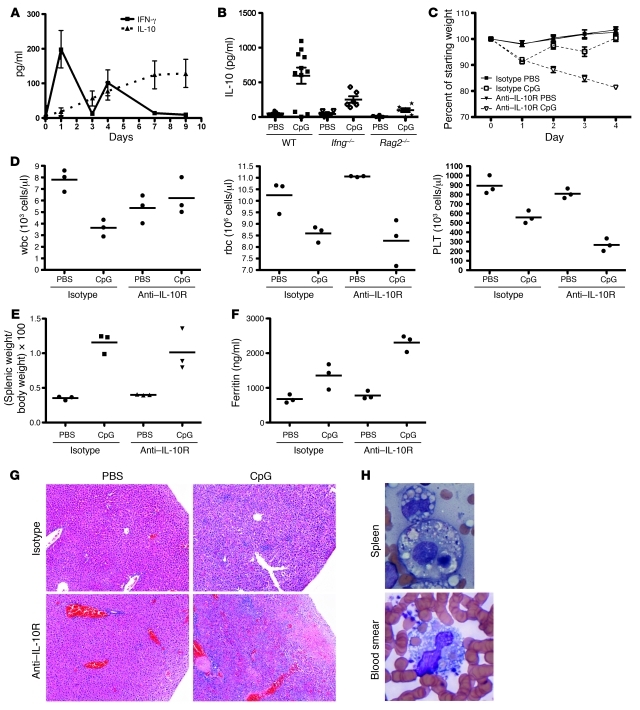
Hemophagocytic lymphohistiocytosis (HLH) and macrophage activation syndrome (MAS) are 2 similar diseases characterized by a cytokine storm, overwhelming inflammation, multiorgan dysfunction, and death. Animal models of HLH suggest that disease is driven by IFN-γ produced by CD8⁺ lymphocytes stimulated by persistent antigen exposure. In these models and patients with "primary" HLH, the antigen persists due to genetic defects, resulting in ineffective cytotoxic responses by CD8⁺ T cells and poor pathogen clearance. However, infectious triggers are often not identified in patients with MAS, and some patients with HLH or MAS lack defects in cytotoxic T cell killing. Herein, we show that repeated stimulation of TLR9 produced an HLH/MAS-like syndrome on a normal genetic background, without exogenous antigen. Like previous HLH models, TLR9-induced MAS was IFN-γ dependent; however, unlike other models, disease did not require lymphocytes. We further showed that IL-10 played a protective role in this model and that blocking IL-10 signaling led to the development of hemophagocytosis. IL-10 may therefore be an important target for the development of effective therapeutics for MAS. Our data provide insight into MAS-like syndromes in patients with inflammatory diseases in which there is chronic innate immune activation but no genetic defects in cytotoxic cell function.


Figures

Figure 1
Figure 1. Repeatedly CpG-treated mice develop clinical features of cytokine storm.
Mice were treated over a 10-day period with repeated injections of PBS or CpG (50 μg) every 2 days. (A) Blood was sampled on day 8 for a complete blood count and analyzed for total leukocytes (wbc), rbc, and platelets (PLT). (B) The leukopenia associated with CpG treatment was further characterized by assessing lymphocyte and granulocyte numbers. (CE) Analyses were performed at sacrifice on day 10. (C and D) Spleens from mice were weighed and are expressed at a ratio to total body weight. Total splenocyte numbers were assessed by counts with a hemacytometer. (E) Serum ferritin was measured by ELISA. (F) Livers from mice were sectioned and stained with H&E (original magnification, ×40). Fibrin thrombi (thick arrows) and associated tissue necrosis (thin arrows) were seen only in CpG-treated mice. Individual symbols each represent 1 mouse, with the horizontal lines representing the mean values. *P < 0.05 versus PBS for all panels. Data are representative of 3 experiments.
Figure 2
Figure 2. Repeatedly CpG-treated mice develop serologic and histologic features of cytokine storm.
Mice were treated with PBS and CpG as in Figure 1. (A) Serum levels of IFN-γ, IL-12, IL-10, and IL-6 were assessed by ELISA at day 10. (BD) Hepatic inflammation was assessed at sacrifice on day 10 by a blinded pathologist using a standardized scoring system as follows: portal inflammation, 0, absent; 1, focal and minimal; 2, mild; 3, moderate; 4, marked; lobular inflammation, 0, absent; 1, rare small foci; 2, occasional small foci; 3, moderate small foci; 4, frequent small foci. (B) Livers were stained with H&E. Lobular infiltrates are marked with short arrows, and portal infiltrates are marked with long double arrows. Representative sections are shown at an original magnification of ×40. (C) Lobular and (D) portal inflammation were scored separately. (E) Hepatic infiltrates were stained by immunohistochemistry for T cell (CD3), B cell (B220), and macrophage (F4/80) markers. Representative sections are shown at an original magnification of ×200. (F) Splenic architecture was assessed by H&E stains of spleens on day 10 (original magnification, ×50 [left]; ×200 [right]). *P < 0.05 versus PBS for all experiments. Data are representative of 3 experiments. Individual symbols each represent 1 mouse, with the horizontal lines representing the mean values.
Figure 3
Figure 3. IFN-γ is required for maximal CpG-induced cytokine storm disease expression.
Ifng–/– mice were treated with PBS or CpG, and data are analyzed as in Figure 1. Compared with wild-type counterparts, (A and B) Ifng–/– mice have reduced anemia and thrombocytopenia, (C) reduced splenomegaly, and (D) complete elimination of hepatic inflammation. In contrast to the experiments shown in Figure 1, there was no difference in (A and B) the degree of leukopenia or (E) hyperferritinemia. *P < 0.05. Data are representative of 3 experiments. Individual symbols each represent 1 mouse, with the horizontal lines representing the mean values.
Figure 4
Figure 4. Blockade of late-phase IFN-γ is sufficient to ameliorate disease.
(A) Levels of IFN-γ were measured from mice repeatedly injected with CpG, showing a biphasic response with an early higher level followed by lower levels, comparable to what is seen on day 10 (Figure 2A). (B and C) Mice were treated with PBS alone (PBS) or repeated CpG injections along with an IFN-γ–neutralizing antibody from day 0 (full blockade) or day 3 (second-phase blockade) or with an irrelevant isotype antibody (no blockade). (B) Cell counts were measured at sacrifice on day 10. (C) Spleen size (ratio of splenic weight to total body weight) was assessed at sacrifice. Data are representative of 2 experiments. Individual symbols each represent 1 mouse, with the horizontal lines representing the mean values.
Figure 5
Figure 5. Adaptive immunity is not required for CpG-induced cytopenia or splenomegaly or IFN production.
(A and B) Wild-type or B2m–/– mice were treated with PBS or CpG as in Figure 1. (A) Peripheral blood cell counts were measured at 8 days and (B) spleen size measured at sacrifice at day 10. Results are representative of 2 experiments. (CE) WT and Rag2–/– mice were treated with PBS or CpG as in Figure 1. (C) Peripheral blood cell counts were assessed at day 8, and (D) spleen size was assessed at sacrifice at day 10. (E) IFN levels in the blood were assessed by serum ELISA (day 10) for each group of mice. Data are representative of 2 experiments. (F) Liver sections taken at day sacrifice on day were stained by H&E. Representative sections are shown at an original magnification of ×40. Individual symbols each represent 1 mouse, with the horizontal lines representing the mean values. *P < 0.05 versus PBS for all panels.
Figure 6
Figure 6. NK cells are activated by CpG treatment.
Wild-type mice were treated with CpG as in Figure 1. (A) NK cells, identified as CD3B220NK1.1+CD122+DX5+ cells, are virtually absent in the spleens of wild-type mice treated with CpG. Percentages shown are of total splenic lymphocytes. Plots are representative of 3 experiments. (B) Splenic NK cells from wild-type and B2m–/– mice were analyzed for CD69, IFN-γ, and light scatter changes 16 hours after a single CpG injection. The numbers represent the percentage of NK cells falling into each quadrant of the CD69/IFN-γ plot. Plots are representative of 3 experiments. Data are representative of 3 experiments. FSC, forward scatter; SSC, side scatter.
Figure 7
Figure 7. Simultaneous deletion of NK cells and lymphocytes partially reduces the severity of CpG-induced HLH/MAS-like syndrome, whereas cDCs are required for early-phase IFN-γ production but are dispensable for disease.
(AC) Rag2–/– and Rag2–/–Il2rg–/– mice were treated with repeated PBS or CpG injections as in Figure 1. (A) Peripheral blood counts were assessed at day 8, and spleen size was assessed at day 10. (B) Liver inflammation, assessed at day 10, was quantitated as in Figure 2. (C) Serum IFN-γ levels were also assessed at day 10. Data are representative of 2 experiments. (DG) CD11c-DTR marrow was injected into lethally irradiated wild-type mice that were then allowed to rest for 8 weeks. These mice were then injected on alternating days with DT (100 ng) and either CpG or PBS as in Figure 1. (D) IFN-γ levels were measured by ELISA on day 1 and day 10. (E) Peripheral blood counts were assessed at day 8, and (F) spleen size was assessed at day 10. (G) Liver inflammation, assessed at day 10, was quantitated as in Figure 2. Individual symbols each represent 1 mouse, with the horizontal lines representing the mean values.
Figure 8
Figure 8. IL-10 receptor blockade results in a more severe MAS-like phenotype with the presence of hemophagocytosis.
(A) Serum IL-10 (dotted line) and IFN-γ (solid line) levels were measured by ELISA over the course of repeated CpG injections. (B) Serum IL-10 levels were measured by ELISA at day 10 of repeated CpG injection in wild-type, Ifng–/–, and Rag2–/– mice. (CF) Mice were given repeated CpG or PBS injections according to the same schedule as in Figure 1. Mice were given concurrent injections of isotype or anti–IL-10R antibody with each dose. (C) Daily weights were measured, (D) complete blood count was performed on day 5, and (E) splenic weight and (F) serum ferritin were measured at sacrifice at day 6, when most mice receiving anti–IL-10R treatment became moribund. (G) Livers taken at sacrifice on day 6 were stained by H&E. Representative sections are shown at an original magnification of ×100. (H) Splenic touch preparations were made at sacrifice on day 6, and peripheral blood smears made at the time of complete blood count on day 5 were stained by Wright-Giemsa and evaluated for hemophagocytosis. Representative fields (original magnification, ×1,000 fields) are shown for mice receiving both CpG and anti–IL-10R antibody. All results are representative of 3–4 experiments. Individual symbols each represent 1 mouse, with the horizontal lines representing the mean values.

References

    1. Suntharalingam G, et al. Cytokine storm in a phase 1 trial of the anti-CD28 monoclonal antibody TGN1412. N Engl J Med. 2006;355(10):1018–1028. doi: 10.1056/NEJMoa063842. - DOI - PubMed
    1. Sriskandan S, Altmann DM. The immunology of sepsis. J Pathol. 2008;214(2):211–223. doi: 10.1002/path.2274. - DOI - PubMed
    1. Fujiwara F, Hibi S, Imashuku S. Hypercytokinemia in hemophagocytic syndrome. Am J Pediatr Hematol Oncol. 1993;15(1):92–98. doi: 10.1097/00043426-199302000-00012. - DOI - PubMed
    1. Amaral MC, Alves JD. Pathogenesis of multi-organic failure in autoimmune diseases. Autoimmun Rev. 2009;8(6):525–528. doi: 10.1016/j.autrev.2009.01.009. - DOI - PubMed
    1. Castillo L, Carcillo J. Secondary hemophagocytic lymphohistiocytosis and severe sepsis/ systemic inflammatory response syndrome/multiorgan dysfunction syndrome/macrophage activation syndrome share common intermediate phenotypes on a spectrum of inflammation. Pediatr Crit Care Med. 2009;10(3):387–392. - PubMed

Publication types

MeSH terms