Comparative Study
. 2011 Aug;38(4):405-21.
doi: 10.1007/s10928-011-9200-x. Epub 2011 May 17.

Development of appropriate equations for physiologically based pharmacokinetic modeling of permeability-limited and flow-limited transport

Affiliations
Comparative Study

Development of appropriate equations for physiologically based pharmacokinetic modeling of permeability-limited and flow-limited transport

Matthew D Thompson et al. J Pharmacokinet Pharmacodyn. 2011 Aug.

Abstract

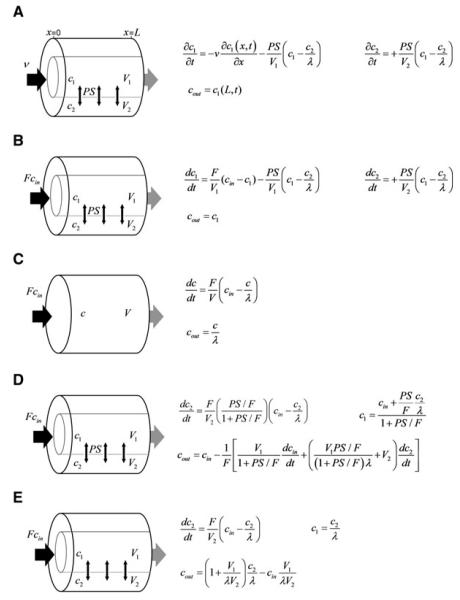
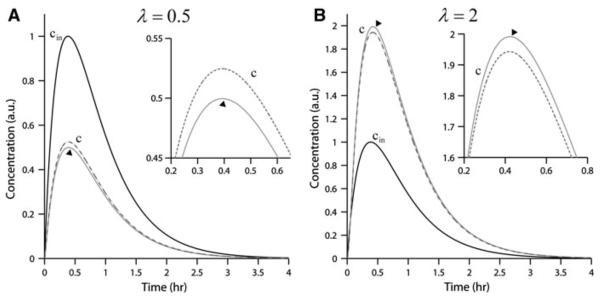
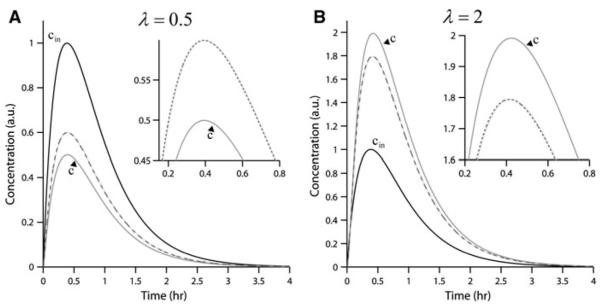
Although the implementation of a flow-limited, well-stirred tank (WST) single-compartment tissue model in pharmacokinetics and toxicokinetics is widespread, its use is not always justified biophysically or physiologically. The WST model introduces a loss of biophysical detail, specifically the vascular space, which is present in the standard permeability-limited two-subcompartment (PLT) tissue model. To address this loss of detail when evaluating the in vivo kinetics of drugs, toxins, nutrients, and endogenous metabolites, a novel set of physiologically based pharmacokinetic tissue compartment equations is developed through application of an asymptotic approximation to a two-region vascular-extravascular system to arrive at a permeability-limited two-region asymptotically reduced (P-TAR) model and a flow-limited (F-TAR) model. Development of the TAR modeling approach illustrates the importance of relative timescales in PBPK tissue compartment model selection and the conditions under which improved biophysical realism is advantageous. In the permeability-limited regime, the TAR model formulations enable drug or toxicant concentration to be modeled in the vascular and extravascular spaces equivalent to the PLT tissue model while invoking only one state variable to represent the vascular and extravascular spaces. In the flow-limited regime, the F-TAR model is more biophysically realistic than the WST model because it maintains the anatomical distinction between the vascular and extravascular spaces, and hence offers greater pharmacological and physiological insight than the WST model, without introducing additional computational complexity.


Figures

Fig. 1
Fig. 1
PBPK tissue compartment model diagrams and equations. a Spatially distributed model (Case I; Eqs. 5a, 5b); b permeability-limited two-subcompartment (PLT) model (Case II—spatially homogenized, lumped compartmental, Eqs. 7a, 7b; diffusion-limited, Eqs. 2a, 2b); c well-stirred tank (WST) model (Case III, flow-limited, or venous equilibrium; Eq. 1); d permeability-limited two-region asymptotically reduced (P-TAR) model (Eqs. 12a, 12b); e flow-limited two-region asymptotically reduced (F-TAR) model (Eqs. 17a, 17b). Additional conditions for outflow concentrations for the P-TAR and F-TAR models are given in Table 1
Fig. 2
Fig. 2
Comparison of PLT and P-TAR tissue compartment models with rapid inflow kinetics. a Inflow concentration (cin, solid black line), concentration in the vascular subcompartment/region (c1) (PLT model, solid light gray line; P-TAR model, dashed light gray line), and concentration in the extravascular subcompartment/region (c2) (PLT model, solid dark gray line; P-TAR model, dashed dark gray line). b Inflow concentration (cin, solid black line) and outflow concentration (cout) (PLT model, solid gray line; P-TAR model, dashed gray line). Rapid timescale is based on Eq. 24 with simulation time being 200 s, ka = 1 s−1, and kel = 0.05 s−1; physiological parameters: V1 = 0.05 l, V2 = 0.95 l, F = 1 l min−1; drug-specific parameters: λ = 1 and PS/F = 1. Arbitrary units (a.u.) of concentration are plotted versus time in seconds. Insets show initial 20 s
Fig. 3
Fig. 3
Comparison of PLT and P-TAR tissue compartment models with slow inflow kinetics. a Inflow concentration (cin, solid black line), concentration in the vascular subcompartment/region (c1) (PLT model, solid light gray line; P-TAR model, dashed light gray line), and concentration in the extravascular subcompartment/region (c2) (PLT model, solid dark gray line; P-TAR model, dashed dark gray line). b Inflow concentration (cin, solid black line) and outflow concentration (cout) (PLT model, solid gray line; P-TAR model, dashed gray line). Slow timescale is based on Eq. 24 with simulation time being 4 h with ka = 0.001 s−1 and kel = 0.0005 s−1; physiological parameters: V1 = 0.05 l, V2 = 0.95 l, F = 1 l min−1; drug-specific parameters: λ = 1 and PS/F = 1. Arbitrary units (a.u.) of concentration are plotted versus time in hours. Black arrowheads indicate values trail inflow concentration. Top insets show simulations near peak of time course (in seconds). Bottom insets show initial 30 s
Fig. 4
Fig. 4
Comparison of WST and F-TAR tissue compartment models with rapid inflow kinetics. a Inflow concentration (cin, solid black line) and concentration in the overall compartment (c) (WST model, solid light gray line; F-TAR model, dashed dark gray line). b Inflow concentration (cin, solid black line) and outflow concentration (cout) (WST model, solid gray line; F-TAR model, dashed gray line). Rapid timescale is based on Eq. 24 with simulation time being 200 s, ka = 1 s−1, and kel = 0.05 s−1; physiological parameters: V1 = 0.05 l, V2 = 0.95 l, F = 1 l min−1; drug-specific parameters: λ = 1 and PS/F = 1. Arbitrary units (a.u.) of concentration are plotted versus time in seconds. Insets show initial 20 s
Fig. 5
Fig. 5
Comparison of WST, F-TAR, and flow-limited PLT models while varying λ with slow inflow kinetics. a λ = 0.5; b λ = 2. a, b Inflow concentration (cin, solid black line) and concentration in the overall compartment (c) (WST model, solid dark gray line; F-TAR model, dashed dark gray line; flow-limited PLT model, solid light gray line). Black arrowhead indicates where WST model solution deviates from flow-limited PLT and F-TAR. Slow timescale is based on Eq. 24 with simulation time being 4 h with ka = 0.001 s−1 and kel = 0.0005 s−1; physiological parameters: V1 = 0.05 l, V2 = 0.95 l, F = 1 l min−1; drug-specific parameter: PS/F = 100. Arbitrary units (a.u.) of concentration are plotted versus time in hours
Fig. 6
Fig. 6
Comparison of WST, F-TAR, and flow-limited PLT models while varying λ and vascular volume with slow inflow kinetics. a λ = 0.5; b λ = 2. a, b Inflow concentration (cin, solid black line) and concentration in the overall compartment (c) (WST model, solid dark gray line; F-TAR model, dashed dark gray line; flow-limited PLT model, solid light gray line). Black arrowhead indicates where WST model solution deviates from flow-limited PLT and F-TAR. Slow timescale is based on Eq. 24 with simulation time being 4 h with ka = 0.001 s−1 and kel = 0.0005 s−1; physiological parameters: V1 = 0.2 l, V2 = 0.8 l, F = 1 l min−1; drug-specific parameter: PS/F = 100. Arbitrary units (a.u.) of concentration are plotted versus time in hours

References

    1. Theil FP, Guentert TW, Haddad S, Poulin P. Utility of physiologically based pharmacokinetic models to drug development and rational drug discovery candidate selection. Toxicol Lett. 2003;138:29–49. - PubMed
    1. Poulin P, Theil FP. Prediction of pharmacokinetics prior to in vivo studies. II. Generic physiologically based pharmacokinetic models of drug disposition. J Pharm Sci. 2002;91:1358–1370. - PubMed
    1. Andersen ME, Clewell H, III, Krishnan K. Tissue dosimetry, pharmacokinetic modeling, and interspecies scaling factors. Risk Anal. 1995;15:533–537. - PubMed
    1. Yang F, Tong X, McCarver DG, Hines RN, Beard DA. Population-based analysis of methadone distribution and metabolism using an age-dependent physiologically based pharmacokinetic model. J Pharmacokinet Pharmacodyn. 2006;33:485–518. - PubMed
    1. Thompson CM, Johns DO, Sonawane B, Barton HA, Hattis D, Tardif R, Krishnan K. Database for physiologically based pharmacokinetic (PBPK) modeling: physiological data for healthy and health-impaired elderly. J Toxicol Environ Health B Crit Rev. 2009;12:1–24. - PubMed

Publication types