. 2011 Nov;31(3):701-11.
doi: 10.1007/s10827-011-0340-1. Epub 2011 May 17.

Conflicting effects of excitatory synaptic and electric coupling on the dynamics of square-wave bursters

Affiliations

Conflicting effects of excitatory synaptic and electric coupling on the dynamics of square-wave bursters

Natalia Toporikova et al. J Comput Neurosci. 2011 Nov.

Abstract

Using two-cell and 50-cell networks of square-wave bursters, we studied how excitatory coupling of individual neurons affects the bursting output of the network. Our results show that the effects of synaptic excitation vs. electrical coupling are distinct. Increasing excitatory synaptic coupling generally increases burst duration. Electrical coupling also increases burst duration for low to moderate values, but at sufficiently strong values promotes a switch to highly synchronous bursts where further increases in electrical or synaptic coupling have a minimal effect on burst duration. These effects are largely mediated by spike synchrony, which is determined by the stability of the in-phase spiking solution during the burst. Even when both coupling mechanisms are strong, one form (in-phase or anti-phase) of spike synchrony will determine the burst dynamics, resulting in a sharp boundary in the space of the coupling parameters. This boundary exists in both two cell and network simulations. We use these results to interpret the effects of gap-junction blockers on the neuronal circuitry that underlies respiration.


Figures
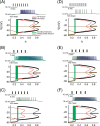
Fig. 1
Fig. 1
Bifurcation diagrams of two-cell network simulations. From top to bottom, Panels (a–c) illustrate the simulation results when Gsyn is fixed at 3.0 nS, and (a) Ggap=0 nS, (b) Ggap=0.5 nS, and (c) Ggap=1.5 nS. Similarly, Panels (d) through (f) illustrate the results when Ggap is fixed at 0.7 nS, and (d) Gsyn=0.75 nS, (e) Gsyn=1.5 nS, and (f) Gsyn=3 nS. Insets in each panel show the spiking profile that occurs within each burst. IP: black. AP: red. Bursting trajectory: green. Equilibrium solution: brown. For all diagrams x-axis represents h, and the y-axis represents membrane voltage (similar to axes on panels (a)and (d))
Fig. 2
Fig. 2
Profiles of the bifurcation diagrams with coupling strengths being Gsyn=0, 1, 2 nS and Ggap=0.1, 0.5, 1, 1.5 nS. The highlighted row and column shows the behavior of the bursting trajectory, and changes in the two periodic solution branches AP (red) and IP (black)
Fig. 3
Fig. 3
Panel (a) is a zoomed-in version of Fig. 2. Panel (b) illustrates the metric proposed to categorize the convergence of bursting trajectory. Panel (c) compares the change in burst duration (as the coupling strengths are varied) versus the switch in the sign of the metric (hstable – hLK). The black curve the boundary where hstable – hLK=0. Note that Ggap is incremented in 0.1 nS in panel (c). The dashed line in Panel (a) represents the transition of (hstable-hLK) between positive and negative value. The value of (hstable – hLK) is positive for the sub-panels in the bottom-right corner; and negative for the sub-panels on the top-left corner. Accordingly, the bursting trajectory (green) for the three sub-panels in the bottom-right converges to the AP branch (red), and to the IP branch (black) for the top left five sub-panels
Fig. 4
Fig. 4
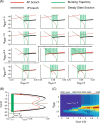
Effects Ggap and Gsyn on burst duration (panel a) and spike synchrony (panel d). The Spike Deviation Index (SDI) color-coded in panel (d) is described in section 2. Panels (b/e) are raster plots of several periods of bursting (b) and a single burst (e) within the network for 4 sets of coupling parameters indicated by the solid black boxes in panels (a/d); the parameter sets are: Ggap=0, 1, 2, and 2.25 nS, with Gsyn fixed at 2.25 nS. Panel (c/f) contain the same information for 3 sets of coupling parameters indicated by the dashed black boxes in panels (a/d); these parameters are: Ggap=1.5 nS, with Gsyn=0, 1.25, and 3 nS
Fig. 5
Fig. 5
Panel (a) is identical to Panel (a) of Fig. 4, illustrating how burst duration changes with respect to changes in coupling strengths. Panel (b) demonstrates the appearance of a dominant intra-burst spiking frequency as gap-junctional coupling strength is varied. The x-axis runs from 0 to 60 Hz, showing the range of intra-burst spiking frequency. The y-axis shows the percentage of occurrences of a specific spiking frequency within a single burst. The coupling strengths used to generate the spike-frequency spectrum in Panel (b) correspond to the solid black boxes in Panel (a)

Similar articles

References

    1. Bertram R, Butte MJ, Kiemel T, Sherman A. Topological and phenomenological classification of bursting oscillations. Bulletin of Mathematical Biology. 1995;57:413–439. - PubMed
    1. Best J, Borisyuk A, Rubin J, Terman D, Wechselberger M. The dynamic range of bursting in a model respiratory pacemaker network. SIAM Journal on Applied Dynamical Systems. 2005;4:1107–1139.
    1. Bou-Flores C, Berger AJ. Gap junctions and inhibitory synapses modulate inspiratory motoneuron synchronization. Journal of Neurophysiology. 2001;85:1543–1551. - PubMed
    1. Butera RJ, Jr., Rinzel J, Smith JC. Models of respiratory rhythm generation in the pre-Botzinger complex. I. Bursting pacemaker neurons. Journal of Neurophysiology. 1999;82:382–397. - PubMed
    1. De Vries G, Sherman A, Zhu HR. Diffusively coupled bursters: effects of cell heterogeneity. Bulletin of Mathematical Biology. 1998;60:1167–1200. - PubMed

Publication types

LinkOut - more resources