. 2011 Oct;17(10):973-82.
doi: 10.1089/ten.TEC.2011.0185. Epub 2011 Jun 29.

Laser printing of three-dimensional multicellular arrays for studies of cell-cell and cell-environment interactions

Affiliations

Laser printing of three-dimensional multicellular arrays for studies of cell-cell and cell-environment interactions

Martin Gruene et al. Tissue Eng Part C Methods. 2011 Oct.

Abstract

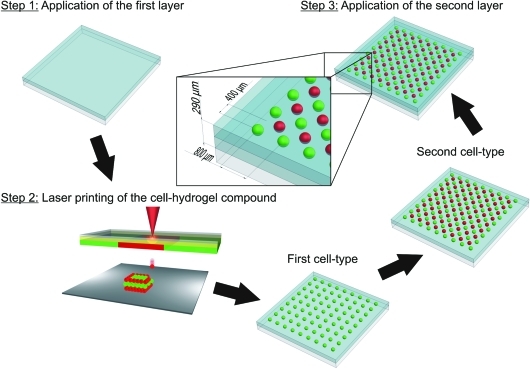
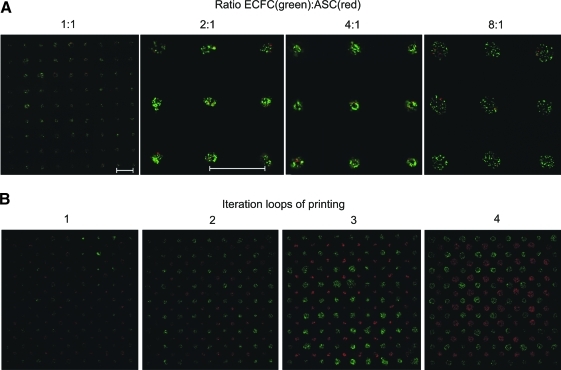
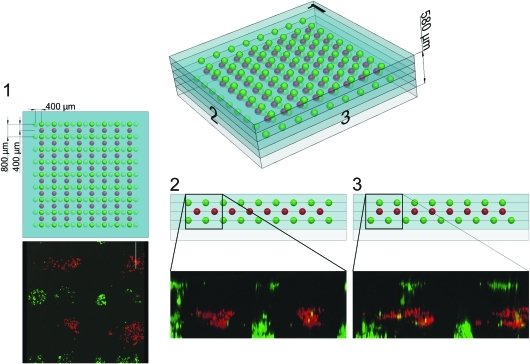
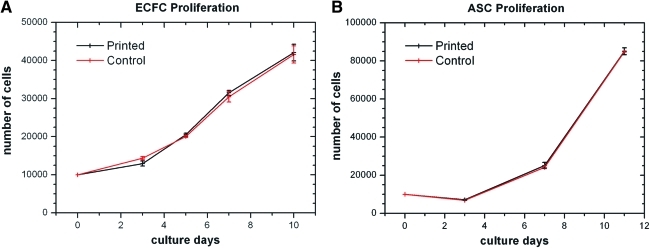
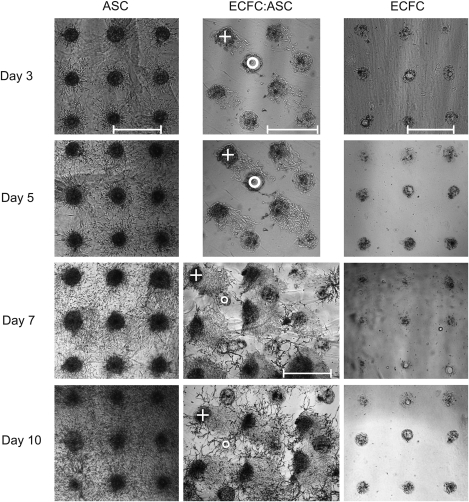
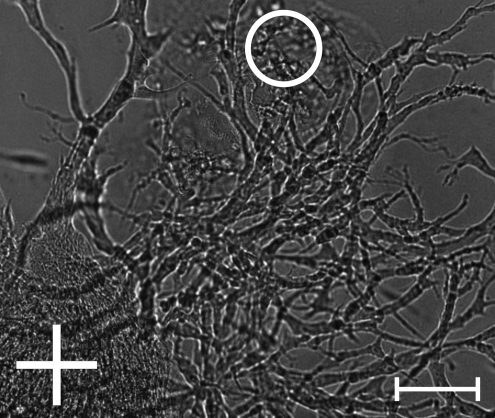
Utilization of living cells for therapies in regenerative medicine requires a fundamental understanding of the interactions between different cells and their environment. Moreover, common models based on adherent two-dimensional cultures are not appropriate to simulate the complex interactions that occur in a three-dimensional (3D) cell-microenvironment in vivo. In this study, we present a computer-aided method for the printing of multiple cell types in a 3D array using laser-assisted bioprinting. By printing spots of human adipose-derived stem cells (ASCs) and endothelial colony-forming cells (ECFCs), we demonstrate that (i) these cell spots can be arranged layer-by-layer in a 3D array; (ii) any cell-cell ratio, cell quantity, cell-type combination, and spot spacing can be realized within this array; and (iii) the height of the 3D array is freely scalable. As a proof of concept, we printed separate spots of ASCs and ECFCs within a 3D array and observed cell-cell interactions in vascular endothelial growth factor-free medium. It has been demonstrated that direct cell-cell contacts trigger the development of stable vascular-like networks. This method can be applied to study complex and dynamic relationships between cells and their local environment.


Figures

FIG. 1.
FIG. 1.
Schematic illustration of the generation of cell arrays by LaBP. Step 1: The first HA–fibrinogen layer is blade-coated on the collector slide and subsequently wetted with the crosslinking agent; Step 2: The first (green spots) and second (red spots) cell types are printed in separated spot arrays at a defined distance to each other by means of LaBP; Step 3: The second HA–fibrinogen layer is blade-coated on top of the cell array and subsequently wetted by a crosslinking agent. LaBP, laser-assisted bioprinting. Color images available online at www.liebertonline.com/tec
FIG. 2.
FIG. 2.
Fluorescence images illustrating the variation of cell–cell ratios (A) and cell amounts (B) within the cell array. ECFCs were stained with calcein (green) and ASCs were stained with TAMRA-5 (red). Scale bars=800 μm. ASC, adipose-derived stem cell; ECFC, endothelial colony-forming cell. Color images available online at www.liebertonline.com/tec
FIG. 3.
FIG. 3.
Three-dimensional reconstruction of the 3D cell array by means of confocal laser scanning microscopy and the corresponding CAD model. ECFCs were stained with calcein (green) and ASCs were stained with TAMRA-5 (red). 3D, three-dimensional. Color images available online at www.liebertonline.com/tec
FIG. 4.
FIG. 4.
Statistical assessment of proliferation ability from printed cells with respect to their nonprinted control. ECFCs (A) and ASCs (B) were counted with a Neubauer hemocytometer. Cell numbers are given as mean±standard error of mean (n=4 for all). Color images available online at www.liebertonline.com/tec
FIG. 5.
FIG. 5.
Visualization of cell–cell interactions by 3D cell arrays in mono- and cocultures. Interactions of ASCs and ECFCs in comparison to separated arrays of ASCs and ECFCs cultivated for 10 days under VEGF-free conditions. A circle indicates the printed ECFC spot and a cross indicates the printed ASC spot. Scale bars=800 μm. VEGF, vascular endothelial growth factor.
FIG. 6.
FIG. 6.
Vascular-like network formation after 2 weeks under VEGF-free culture conditions. A circle indicates the printed ECFC spot and a cross indicates the printed ASC spot. Scale bar=100 μm.

References

    1. Fernandes T.G. Diogo M.M. Clark D.S. Dordick J.S. Cabral J.M.S. High-throughput cellular microarray platforms: applications in drug discovery, toxicology and stem cell research. Trends Biotechnol. 2009;27:342. - PMC - PubMed
    1. Yarmush M.L. King K.R. Living-cell microarrays. Annu Rev Biomed Eng. 2009;11:235. - PMC - PubMed
    1. Butte A. The use and analysis of microarray data. Nat Rev Drug Discov. 2002;1:951. - PubMed
    1. Bhadriraju K. Chen C.S. Engineering cellular microenvironments to improve cell-based drug testing. Drug Discov Today. 2002;7:612. - PubMed
    1. Flaim C.J. Chien S. Bhatia S.N. An extracellular matrix microarray for probing cellular differentiation. Nat Methods. 2005;2:119. - PubMed

Publication types

Substances