. 2011 Aug;62(12):4345-54.
doi: 10.1093/jxb/err150. Epub 2011 May 16.

Fruit ripening in Vitis vinifera: spatiotemporal relationships among turgor, sugar accumulation, and anthocyanin biosynthesis

Affiliations

Fruit ripening in Vitis vinifera: spatiotemporal relationships among turgor, sugar accumulation, and anthocyanin biosynthesis

Simone D Castellarin et al. J Exp Bot. 2011 Aug.

Abstract

This study reports the first observations indicating the spatiotemporal relationships among genetic and physiological aspects of ripening in the berry of Vitis vinifera. At the onset of ripening in the red flesh variety Alicante Bouschet, colour development began in the flesh at the stylar end of the fruit and progressed toward the pedicel end flesh and into the skin. Tissue solute potential and cell turgor also decreased first in the flesh. The decrease in flesh solute potential was due to accumulation of sugars, glucose and fructose, an accumulation that is integral to ripening. Expression of the anthocyanin biosynthesis-related genes VvMybA and VvUFGT was linearly related to the decrease in solute potential. Expression of VvMybA, and to a lesser extent VvUFGT, was correspondingly low in green tissue, higher in the red, stylar end flesh of berries beginning to ripen, and greatest in red berries. In contrast, expression of the abscisic acid biosynthesis-related genes VvNCED1 and VvNCED2 was not correlated with the other spatiotemporal aspects of the onset of ripening. These results, together with earlier work showing that sugar accumulation and acid loss also begin in the stylar flesh in other varieties, indicate that ripening in the grape berry originates in the stylar end flesh.


Figures

Fig. 1.
Fig. 1.
Pictures of whole and dissected Alicante Bouschet berries at various ripening stages. Whole (A) Green, (B) Transition, and (C) Red berries. Dissected (D) Green, (E) Transition, and (F) Red berries with representative flesh and skin tissues boxed. Scale bars for D–F are 2 mm.
Fig. 2.
Fig. 2.
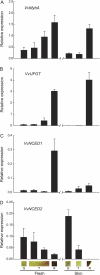
Expression profiling of various ripening-related genes in flesh and skins of Alicante Bouschet berries around the onset of ripening. Expression profiles of the anthocyanin biosynthetic genes, (A) VvMybA and (B) VvUFGT, and of the ABA biosynthetic genes, (C) VvNCED1 and (D) VvNCED2. Boxes on the x-axis report the analysed tissues with representative pictures from Fig. 1. Flesh and skins of G, Green; T, Transition; and R, Red berries. Data are the mean ±SE (n=3).
Fig. 3.
Fig. 3.
Tissue solute potential and hexose concentration. (A) Skin and flesh tissue solute potential in G, Green; T, Transition; and R, Red berries. (B) Linear regression between glucose+fructose concentration and solute potential in flesh and skin tissues of Green and Transition berries. In Transition berries, green and red flesh were analysed separately. r2 and one-way ANOVA significance value are presented.
Fig. 4.
Fig. 4.
Relationship between tissue solute potential (Ψs) and gene expression. Linear regression between Ψs and the magnitude of (A) VvMybA and (B) VvUFGT gene expression across all data. One-way ANOVA significance values are presented.
Fig. 5.
Fig. 5.
In situ measurements of cell turgor pressure (P) in green and red sections of Transition berries. (A) Cross-section of a probed berry (taken after probing) showing the three locations which were probed: Loc1–Loc3. The scale bar is 1mm. (B) Average P ±SE across all depths in each location probed. (C) Relationship between probing depth and P across all data. Epicarp depth is denoted by the dotted line and is represented visually in A.

Similar articles

Cited by

References

    1. Ageorges A, Fernandez L, Vialet S, Merdinoglu D, Terrier N, Romieu C. Four specific isogenes of the anthocyanin metabolic pathway are systematically co-expressed with the red colour of grape berries. Plant Science. 2006;170:372–383.
    1. Atanassova R, Leterrier M, Gaillard C, Agasse A, Sagot E, Coutos-Thevenot P, Delrot S. Sugar-regulated expression of a putative hexose transport gene in grape. Plant Physiology. 2003;131:326–334. - PMC - PubMed
    1. Bogs J, Downey MO, Harvey JS, Ashton AR, Tanner GJ, Robinson SP. Proanthocyanidin synthesis and expression of genes encoding leucoanthocyanidin reductase and anthocyanidin reductase in developing grape berries and grapevine leaves. Plant Physiology. 2005;139:652–663. - PMC - PubMed
    1. Boss PK, Davies C, Robinson SP. Analysis of the expression of anthocyanin pathway genes in developing Vitis vinifera L cv Shiraz grape berries and the implications for pathway regulation. Plant Physiology. 1996a;111:1059–1066. - PMC - PubMed
    1. Boss PK, Davies C, Robinson SP. Expression of anthocyanin biosynthesis pathway genes in red and white grapes. Plant Molecular Biology. 1996b;32:565–569. - PubMed

Publication types