. 2011 Aug 19;286(33):29192-29206.
doi: 10.1074/jbc.M110.208249. Epub 2011 May 17.

The extracellular regulated kinase-1 (ERK1) controls regulated alpha-secretase-mediated processing, promoter transactivation, and mRNA levels of the cellular prion protein

Affiliations

The extracellular regulated kinase-1 (ERK1) controls regulated alpha-secretase-mediated processing, promoter transactivation, and mRNA levels of the cellular prion protein

Moustapha Cissé et al. J Biol Chem. .

Erratum in

  • J Biol Chem. 2011 Sep 23;286(38):33708
  • J Biol Chem. 2013 Jul 5;288(27):19646

Abstract

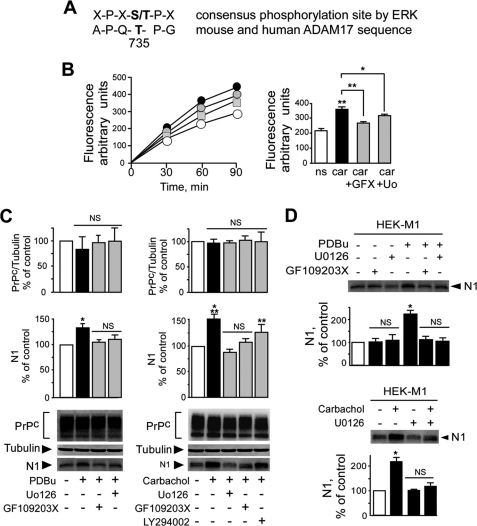
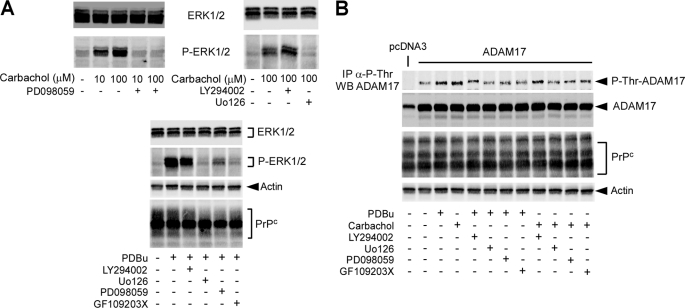
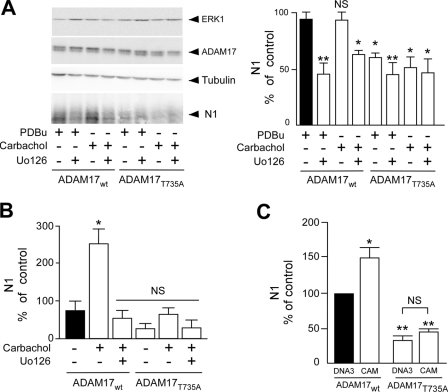
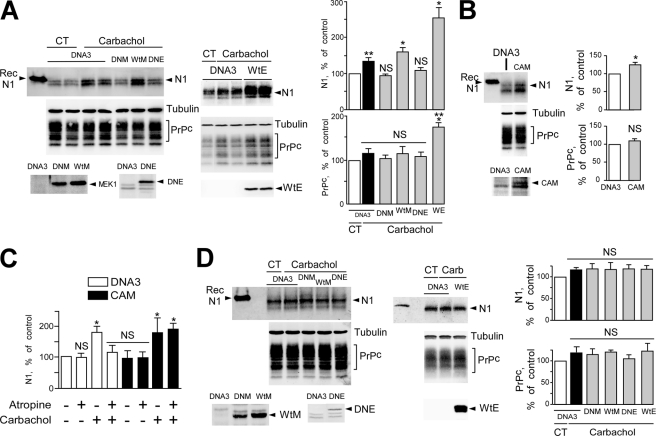
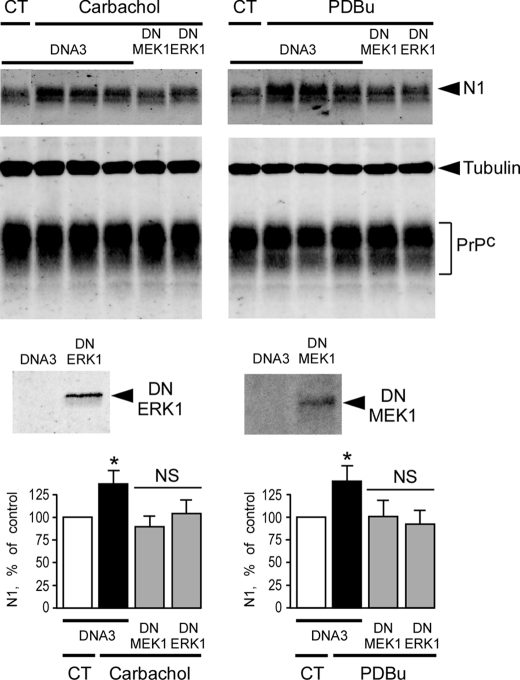
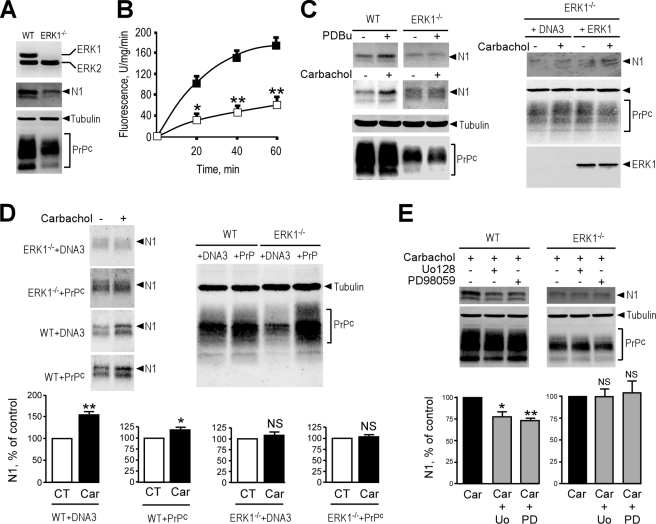
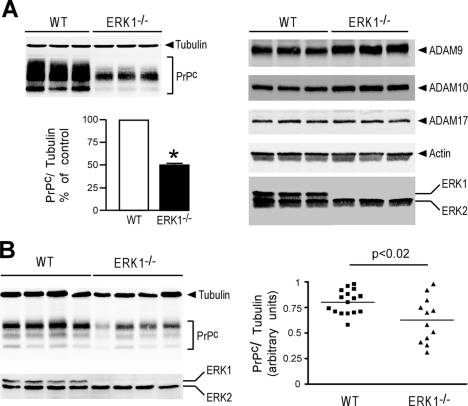
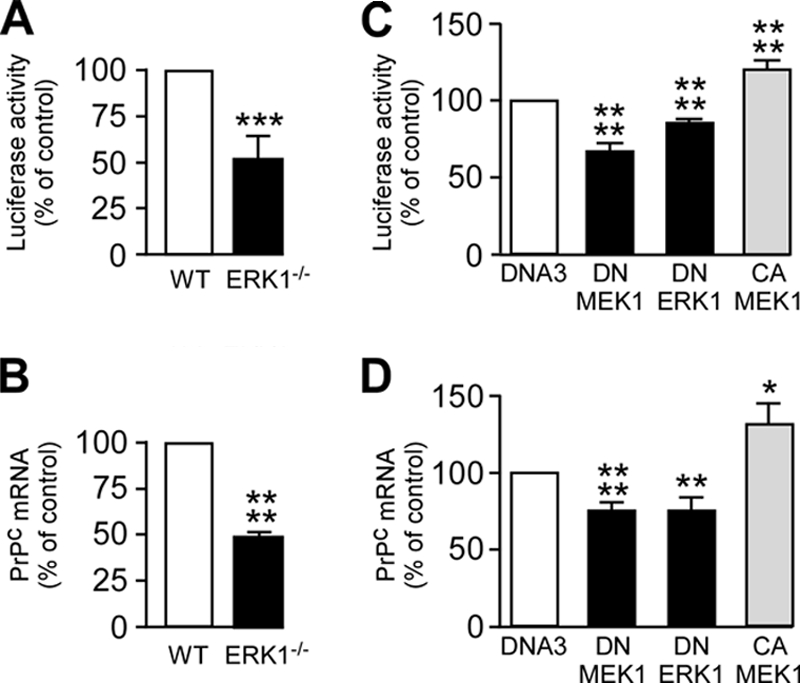
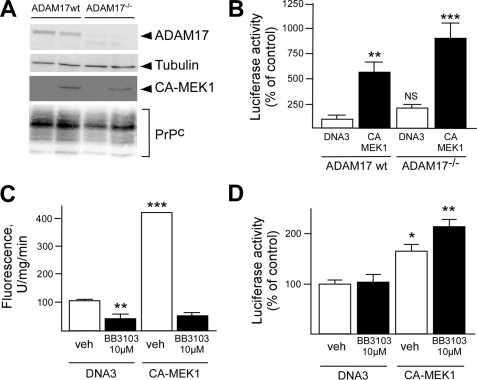
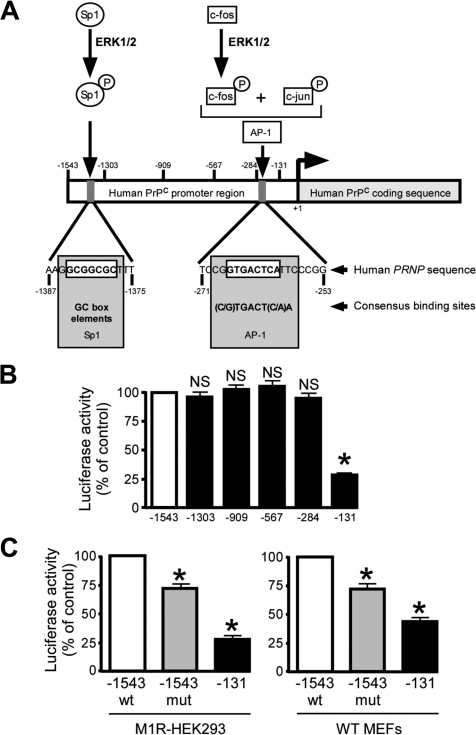
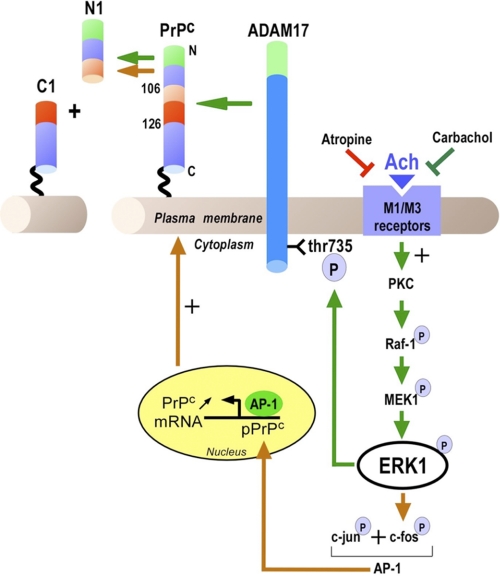
The α-secretases A disintegrin and metalloprotease 10 (ADAM10) and ADAM17 trigger constitutive and regulated processing of the cellular prion protein (PrP(c)) yielding N1 fragment. The latter depends on protein kinase C (PKC)-coupled M1/M3 muscarinic receptor activation and subsequent phosphorylation of ADAM17 on its intracytoplasmic threonine 735. Here we show that regulated PrP(c) processing and ADAM17 phosphorylation and activation are controlled by the extracellular-regulated kinase-1/MAP-ERK kinase (ERK1/MEK) cascade. Thus, reductions of ERK1 or MEK activities by dominant-negative analogs, pharmacological inhibition, or genetic ablation all impair N1 secretion, whereas constitutively active proteins increase N1 recovery in the conditioned medium. Interestingly, we also observed an ERK1-mediated enhanced expression of PrP(c). We demonstrate that the ERK1-associated increase in PrP(c) promoter transactivation and mRNA levels involve transcription factor AP-1 as a downstream effector. Altogether, our data identify ERK1 as an important regulator of PrP(c) cellular homeostasis and indicate that this kinase exerts a dual control of PrP(c) levels through transcriptional and post-transcriptional mechanisms.


Figures

FIGURE 1.
FIGURE 1.
Inhibitors of the ERK/MEK pathway impair PDBu- and carbachol-induced disintegrin activity and N1 recovery. A, alignment of the consensus sequence required for ERK-mediated phosphorylation with amino acids surrounding the cytoplasmic threonine 735 of human and mouse ADAM17. B, cultured M1R-HEK293 cells were pretreated or not for 1 h with GF109203X (2 μm) or Uo126 (10 μm) and monitored for their BB3103-sensitive JMV2770-hydrolyzing activities in the absence or presence of carbachol (Car, 100 μm) as described under “Experimental Procedures.” Aliquots of 100 μl were collected at the indicated times and fluorescence was recorded as described under “Experimental Procedures.” A typical time course of BB3103-sensitive JMV2770 hydrolysis under various conditions is illustrated on the left panel and quantification is shown on the right panel (white circles, non-stimulated (ns); black circles, carbachol- (carba) stimulated; gray squares, carbachol + GFX109203X (GFX); gray circles, carbachol + U0126). Statistical analyses performed at 60 min (right panel) are the mean ± S.E. of three independent experiments. *, p < 0.05; **, p < 0.001. C, M1R-HEK293 cells grown in 35-mm dishes were transiently transfected with Mo3F4 PrPc cDNA as described under “Experimental Procedures.” Twenty-four hours after transfection, cells were pretreated (+) or not (−) for 1 h with the indicated inhibitors. Media were removed, and cells were incubated for 8 h in the absence (−) or presence (+) of PDBu (left panel) or carbachol (right panel). N1 content in conditioned medium as well as PrPc and tubulin immunoreactivities in cell lysates were analyzed as described under “Experimental Procedures.” Bars corresponding to the densitometric analyses are expressed as a percentage of control (non-stimulated cells) taken as 100 and represent the mean ± S.E. of six independent experiments. *, p < 0.05; **, p < 0.005; ***, p < 0.0001; NS, non-statistically significant. D, HEK-M1 cells were treated with the indicated inhibitors for 30 min. After removal of medium, cells were incubated for 8 h without (−) or with (+) PDBu (1 μm, upper panel) or carbachol (100 μm, lower panel) then constitutive or regulated N1 were monitored as described under “Experimental Procedures.” Bars corresponding to the densitometric analyses of N1 are expressed as a percentage of control (non-stimulated cells in absence of inhibitors) taken as 100 and represent the mean ± S.E. of three independent experiments. *, p < 0.0005; NS, non-statistically significant.
FIGURE 2.
FIGURE 2.
Inhibitors of the ERK/MEK pathway prevent PDBu- and carbachol-dependent ADAM17 phosphorylation on its threonine residue. A, M1R-HEK293 cells grown in 35-mm dishes were pretreated for 1 h without (−) or with (+) the indicated inhibitors (PD098059, 20 μm; LY294002, 5 μm; Uo126, 10 μm; GF109203X, 2 μm) and then incubated for 15 min with (+) or without (−) the indicated concentrations of carbachol (upper panels) or with PDBu (1 μm) (lower panel). Cells were collected, lysed as described under “Experimental Procedures,” analyzed by 12% glycine SDS-PAGE and Western blotting using antibodies specifically directed against phospho-ERK1/2 (P-ERK1/2), total ERK1/2 (ERK1/2), PrPc, or actin. B, M1R-HEK293 cells grown in 35-mm dishes were transiently transfected with empty pcDNA3 or ADAM17 cDNA. Twenty-four hours after transfection, cells were pre-treated for 1 h with inhibitors as in A and then stimulated (+) or not (−) with PDBu (1 μm) or carbachol (100 μm) for 15 min as indicated. Threonine-phosphorylated ADAM17 (P-Thr-ADAM17) was monitored by immunoprecipitation (IP) of 500 μg of proteins with a specific antibody directed against phosphothreonine and Western blotting with an ADAM17-specific antibody as described under “Experimental Procedures.” Fifty μg of the same samples were then submitted to 8 (ADAM17) or 12% (PrPc and actin) glycine SDS-PAGE and Western blotted with specific corresponding antibodies as described under “Experimental Procedures.” All illustrations are typical data of three independent experiments.
FIGURE 3.
FIGURE 3.
Mutation of the threonine 735 of ADAM17 abolishes the ERK-1 dependent α-secretase cleavage of PrPc. A, M1R-HEK293 cells grown in 35-mm dishes were transiently transfected with Mo3F4 PrPc, ERK1, and ADAM17wt or ADAM17T735A cDNAs as described under “Experimental Procedures.” Twenty-four hours after transfection, cells were treated with (+) or without (−) PDBu (1 μm), carbachol (100 μm), and Uo126 (10 μm). Sixteen hours after treatment, N1 content in conditioned media as well as ERK1, ADAM17, and tubulin immunoreactivities in cell lysates were analyzed as described under “Experimental Procedures.” Bars corresponding to the densitometric analyses of N1 immunoprecipitation are expressed as a percentage of control (PDBu-stimulated ADAM17wt-expressing cells, black bar) taken as 100 and represent the mean ± S.E. of five independent experiments. *, p < 0.05; **, p < 0.001; NS, non-statistically significant. B, 3F4-HEK293 cells were transiently transfected with ERK1, M1R, and ADAM17wt or ADAM17T735A cDNAs. Twenty-four hours after transfection cells were treated with (+) or without (−) PDBu (1 μm) or carbachol (100 μm). N1 secretion, PrPc, ADAM17, HA-tagged ERK1, and M1R and tubulin immunoreactivities were measured as described previously. Bars correspond to densitometric analyses of N1 immunoprecipitation normalized by PrPc expression and are expressed as a percentage of control (non-treated ADAM17wt transfected cells, black bar) taken as 100 and represent the mean ± S.E. of three independent experiments. *, p < 0.001; NS, non-statistically significant. C, 3F4-HEK293 cells were transiently transfected with empty pcDNA3 (DNA3) or constitutively active MEK kinase (CAM) with ADAM17wt or ADAM17T735A. N1, PrPc, ADAM17, HA-tagged CAM, and tubulin immunoreactivities were measured as described previously. Bars correspond to densitometric analyses of N1 immunoprecipitation and are expressed as a percentage of control (ADAM17wt, DNA3-transfected cells, black bar) taken as 100 and represent the mean ± S.E. of three independent experiments. *, p < 0.05; **, p < 0.001; NS, non-statistically significant.
FIGURE 4.
FIGURE 4.
Wild-type, dominant-negative, or constitutively active ERK1 or MEK1 modulate carbachol-dependent N1 secretion. A, M1R-HEK293 cells were transiently transfected with Mo3F4 PrPc cDNA together with empty pcDNA3 (DNA3) or with pcDNA3 encoding wild-type ERK1 or MEK1 (WtE or WtM), dominant-negative ERK1 (DNE) or MEK1 (DNM) as indicated. Twenty-four hours after transfection, cells were incubated for 8 h with 1 ml of DMEM in the absence (CT) or presence of carbachol (100 μm), then media were taken out and N1 was immunoprecipitated and detected by 16.5% Tris/Tricine SDS-PAGE and Western blotting with the SAF32 antibody as described under “Experimental Procedures.” Recombinant N1 peptide (Rec N1) was used as a standard. PrPc, tubulin, and HA-tagged WtE, WtM, DNE, and DNM were analyzed as described under “Experimental Procedures.” Bars correspond to densitometric analyses and are expressed as a percentage of control (white bars, non-stimulated cells co-transfected with Mo3F4 PrPc cDNA and pcDNA3) taken as 100 and represent the mean ± S.E. of nine independent experiments. *, p < 0.05; **, p < 0.005; ***, p < 0.0005; NS, non-statistically significant. B and C, M1R-HEK293 cells were co-transfected with Mo3F4 PrPc cDNA and empty vector (DNA3) or pcDNA3 encoding constitutively active MEK1 (CAM). Twenty-four hours after transfection, cells were incubated for 8 h with 1 ml of DMEM without (B) or with 100 μm carbachol, 10 μm atropine, or a combination of both (C). Collected media and cell lysates were assayed for their N1, PrPc, tubulin, and HA-tagged CAM immunoreactivities as described above. Bars correspond to densitometric analyses and are expressed as a percentage of control (non-treated cells co-transfected with Mo3F4 PrPc and pcDNA3) taken as 100 and represent the mean ± S.E. of nine independent experiments. *, p < 0.005; NS, non-statistically significant. D, 3F4-HEK293 cells were transiently transfected with empty pcDNA3 (DNA3) or with WtM, WtE, DNE, or DNM cDNA as indicated and treated as in A. N1, PrPc, tubulin, and HA-tagged WtM, WtE, DNE, or DNM were measured as described in A. Bars correspond to densitometric analyses and are expressed as a percentage of control (white bars, non-stimulated cells transfected with pcDNA3) taken as 100 and represent the mean ± S.E. of six independent experiments. NS, non-statistically significant.
FIGURE 5.
FIGURE 5.
Dominant-negative ERK1 and MEK1 abrogate PDBu- and carbachol-stimulated endogenous production of N1 in mouse primary cultured neurons. Primary neurons were prepared from 14-day-old mouse embryos and cultured for 4 days, then cells were transfected with empty pcDNA3 (DNA3) or with DN-ERK1 or DN-MEK1 cDNAs as indicated. Twenty-four hours after transfection, cells were incubated for 8 h with 1 ml of DMEM in the absence (CT) or presence of PDBU (1 μm) (right panel) or carbachol (100 μm) (left panel). The media were taken out and N1 was immunoprecipitated and Western blotted as described under “Experimental Procedures.” PrPc, tubulin, and HA-tagged ERK1 and MEK1 contents were detected in cell lysates by separating 50 μg of proteins by 12% glycine SDS-PAGE as described under “Experimental Procedures.” Bars correspond to densitometric analyses of N1 and are expressed as a percentage of control (non-stimulated cells transfected with pcDNA3) taken as 100 and represent the mean ± S.E. of six independent experiments. *, p < 0.0001; NS, non-statistically significant. Note that the upper left N1 blot was spliced for a clearer data presentation but that all the lanes derive from the same blot.
FIGURE 6.
FIGURE 6.
ERK1 deficiency impairs PDBu- and carbachol-stimulated recovery of endogenous N1, reduces disintegrin activity, and lowers PrPc expression. A, wild-type (WT) or ERK1-deficient (ERK1−/−) MEFs were incubated for 8 h with 1 ml of DMEM, then N1 was immunoprecipitated and analyzed by 16.5% Tris/Tricine electrophoresis and Western blot as described under “Experimental Procedures.” ERK1/ERK2, PrPc, and tubulin immunoreactivities were analyzed as described under “Experimental Procedures.” B, plated WT (black squares) or ERK1−/− MEFs (white squares) were monitored for their JMV2770-hydrolyzing activity by fluorimetry according to the procedure described under “Experimental Procedures.” Bars correspond to the BB3103-sensitive JMV2770-hydrolyzing activities and are the mean ± S.E. of four independent experiments. *, p < 0.005; **, p < 0.001. C, left panel, N1 secretion as well as PrPc and tubulin immunoreactivities were measured in WT and ERK1−/− MEFs following an 8-h incubation in the absence (−) or presence (+) of PDBu (1 μm) or carbachol (100 μm). Right panel, complementation experiments were carried out in ERK1−/− MEFs by transient transfection with either empty pcDNA3 vector (DNA3) or ERK1 cDNA. Twenty-four hours after transfection, cells were incubated for 8 h with 1 ml of DMEM in the absence (−) or presence (+) of carbachol (100 μm) and N1 recovery, PrPc, and tubulin immunoreactivities were assessed as described under “Experimental Procedures.” D, WT or ERK1−/− MEFs were transiently transfected with either empty pcDNA3 vector (DNA3) or with Mo3F4 PrPc cDNA (PrPc). Twenty-four hours after transfection, cells were treated (+) or not (−) with carbachol (Car, 100 μm) and N1 was immunoprecipitated and analyzed as described under “Experimental Procedures” (upper left panel). PrPc transfection efficacy in both cell lines was verified by Western blot (upper right panel). Bars correspond to densitometric analyses of N1 immunoreactivities in the indicated cell lines and transfection conditions and are expressed as a percentage of control (CT, non-stimulated cells) taken as 100 and represent the mean ± S.E. of eight independent experiments. *, p < 0.005; **, p < 0.0001. E, WT or ERK1−/− fibroblasts were pretreated (+) or not (−) for 1 h with Uo126 (Uo, 10 μm) or PD98059 (PD, 20 μm) and incubated for 8 h in the presence of carbachol (100 μm). Secreted N1 as well as PrPc and tubulin immunoreactivities in lysates were analyzed as described under “Experimental Procedures.” Bars correspond to densitometric analyses of N1 immunoreactivities expressed as a percentage of control (carbachol-stimulated cells in the absence of inhibitors) taken as 100 and represent the mean ± S.E. of three independent determinations. *, p < 0.05; **, p < 0.0001.
FIGURE 7.
FIGURE 7.
ERK1 controls PrPc expression in vitro and in vivo. A, PrPc (left panel), ADAM9, ADAM10, ADAM17, actin, and ERK1/2 (right panels) immunoreactivities were measured in WT and ERK1−/− MEF cell homogenates by SDS-PAGE and Western blot analysis of 50 μg of proteins as described under “Experimental Procedures.” Bars correspond to densitometric analyses of PrPc immunoreactivity (normalized with tubulin) expressed as a percentage of control (WT cells) taken as 100 and represent the mean ± S.E. of 12 independent determinations. *, p < 0.0001. B, PrPc, tubulin, and ERK immunoreactivities in brain homogenates prepared from 7-week-old wild-type (WT) and ERK1−/− mice analyzed as described under “Experimental Procedures” were determined. The right panel shows densitometric analyses of PrPc (normalized by tubulin levels) in brains of 16 wild-type mice and 12 ERK1−/− animals.
FIGURE 8.
FIGURE 8.
ERK1 regulates PrPc expression at a transcriptional level. A and B, PrPc promoter transactivation (A) and mRNA levels (B) were measured as described under “Experimental Procedures” in WT and ERK1−/− MEFs. Black bars represent the ratios of luciferase/β-galactosidase activities normalized by protein concentrations (A) or mRNA levels measured by real-time PCR (B) and are expressed as a percentage of control (WT cells) taken as 100 and are the mean ± S.E. of six independent determinations. C and D, M1R-HEK293 cells were transiently transfected with either empty vector (DNA3) or with DN-ERK1, DN-MEK1 (black bars), or CA-MEK1 (gray bars) cDNAs. After a 36-h period in the presence of carbachol (100 μm), PrPc promoter transactivation (C) and mRNA levels (D) were analyzed as described under “Experimental Procedures.” Bars correspond to the ratios of luciferase/β-galactosidase activities normalized by protein concentrations (C) or mRNA levels measured by real-time PCR (D), and are expressed as a percentage of control (pcDNA3-transfected cells) taken as 100 and are the mean ± S.E. of nine independent determinations. *, p < 0.05; **, p < 0.01; ***, p < 0.001; ****, p < 0.0001.
FIGURE 9.
FIGURE 9.
ADAM17 deficiency and ADAM17 inhibitor do not affect ERK1-mediated regulation of PrPc expression and promoter transactivation. A, WT or ADAM17−/− MEFs were transiently transfected with pcDNA3 empty vector (DNA3) or pcDNA3 encoding constitutively active MEK1 (CA-MEK1). Twenty-four hours after transfection cells were collected, lysed as described under “Experimental Procedures,” and analyzed by 8 or 12% glycine SDS-PAGE and Western blotting using antibodies specifically directed against ADAM17, HA-tagged CA-MEK, PrPc, or tubulin. B, WT or ADAM17−/− MEFs were transiently co-transfected with wild-type full-length PrPc promoter-luciferase construct (−1543 wt) and either DNA3 or CA-MEK1 cDNAs. Thirty-six hours after transfection, luciferase activity was measured as described under “Experimental Procedures.” Values are expressed as percentage of control (MEFs WT transfected with −1543 wt and DNA3) taken as 100 and are the mean ± S.E. of 12 independent determinations. C and D, ADAM17-HEK293 cells were transiently co-transfected with −1543wt, DNA3, or CA-MEK1 cDNAs. Twenty-four hours after transfection, cells were treated or not (vehicle, veh) with BB3103 (10 μm) and monitored for their JMV2770-hydrolyzing activities as described under “Experimental Procedures.” C, values are expressed in fluorescence units per min/mg of protein. Thirty-six hours after transfection, luciferase activity was measured (D) as described under “Experimental Procedures.” Values are expressed as percentage of control (cells transfected with −1543wt and DNA3 without BB3103 treatment) taken as 100 and are the mean ± S.E. of six (C) or four (D) independent determinations. *, p < 0.05; **, p < 0.01; ***, p < 0.001.
FIGURE 10.
FIGURE 10.
Disruption of a putative AP1 responsive element of PrPc promoter reduces ERK-regulated PrPc promoter transactivation. A, theoretical representation of activations of Sp1 and AP-1 by ERK1/2 and localization of two putative binding sites for Sp1 and AP-1 on the human PrPc promoter region. Gray boxes show the regions of the human PRNP promoter harboring putative Sp1 and AP-1 responsive elements (white boxes) compared with their canonical consensus binding sequences. B, M1R-HEK293 cells were transiently transfected with the indicated human PrPc promoter-luciferase constructs (the 5′ deletion mutant constructs of the PrPc promoter region are indicated on the abscissa by their number of nucleotides and schematically localized on the PRNP promoter in A). Thirty-six hours after transfection, luciferase reporter activity was measured as described under “Experimental Procedures.” Bars correspond to the ratios of luciferase/β-galactosidase activities (normalized by protein concentrations) expressed as a percentage of control (activity of the full-length −1543 promoter) taken as 100 and are the mean ± S.E. of nine independent determinations. *, p < 0.001; NS, non-statistically significant. C, M1R-HEK293 cells or WT MEFs were transiently transfected with wild-type full-length PrPc promoter (−1543 wt, white bars), full-length PrPc promoter mutated on its AP-1-binding site (−1543mut, gray bars), or with the AP-1 site-deleted construct (−131, black bars). Thirty-six hours after transfection, luciferase activity was measured as described under “Experimental Procedures.” Values are expressed as a percentage of control (cells transfected with −1543wt) taken as 100 and are the mean ± S.E. of 12 independent determinations. *, p < 0.001.
FIGURE 11.
FIGURE 11.
Schematic representation of the dual ERK1-dependent impact on regulated processing and transcription of PrPc. Stimulation of M1/M3 muscarinic receptors triggers PKC-dependent activation of the MEK/ERK signaling pathway. Activated ERK1 then 1) directly phosphorylates ADAM17 on its intracytoplasmic threonine residue at position 735, thereby increasing ADAM17 activity, the processing of PrPc at the 111/112 peptidyl bond, and the secretion of the neuroprotective N1 fragment; 2) increases PrPc promoter transactivation and mRNA levels in an AP1-dependent manner. Mutational analysis indicates that AP-1 directly activates PrPc transcription likely after formation of well documented ERK-1-dependent build-up with phosphorylation of c-Fos and its subsequent association with phospho-c-Jun (65). Therefore, under physiological conditions, ERK1 participates via two distinct processes (elevation of both substrate levels and enzyme activity) to an overall increase of the N1-associated neuroprotective phenotype.

Similar articles

Cited by

References

    1. Aguzzi A., Calella A. M. (2009) Physiol. Rev. 89, 1105–1152 - PubMed
    1. Prusiner S. B. (1998) Proc. Natl. Acad. Sci. U.S.A. 95, 13363–13383 - PMC - PubMed
    1. Linden R., Martins V. R., Prado M. A., Cammarota M., Izquierdo I., Brentani R. R. (2008) Physiol. Rev. 88, 673–728 - PubMed
    1. Chen S. G., Teplow D. B., Parchi P., Teller J. K., Gambetti P., Autilio-Gambetti L. (1995) J. Biol. Chem. 270, 19173–19180 - PubMed
    1. Forloni G., Angeretti N., Chiesa R., Monzani E., Salmona M., Bugiani O., Tagliavini F. (1993) Nature 362, 543–546 - PubMed

Publication types

MeSH terms

LinkOut - more resources