. 2011 Sep 1;39(16):6919-31.
doi: 10.1093/nar/gkr324. Epub 2011 May 17.

Genome-wide evidence for local DNA methylation spreading from small RNA-targeted sequences in Arabidopsis

Affiliations

Genome-wide evidence for local DNA methylation spreading from small RNA-targeted sequences in Arabidopsis

Ikhlak Ahmed et al. Nucleic Acids Res. .

Abstract

Transposable elements (TEs) and their relics play major roles in genome evolution. However, mobilization of TEs is usually deleterious and strongly repressed. In plants and mammals, this repression is typically associated with DNA methylation, but the relationship between this epigenetic mark and TE sequences has not been investigated systematically. Here, we present an improved annotation of TE sequences and use it to analyze genome-wide DNA methylation maps obtained at single-nucleotide resolution in Arabidopsis. We show that although the majority of TE sequences are methylated, ∼26% are not. Moreover, a significant fraction of TE sequences densely methylated at CG, CHG and CHH sites (where H = A, T or C) have no or few matching small interfering RNA (siRNAs) and are therefore unlikely to be targeted by the RNA-directed DNA methylation (RdDM) machinery. We provide evidence that these TE sequences acquire DNA methylation through spreading from adjacent siRNA-targeted regions. Further, we show that although both methylated and unmethylated TE sequences located in euchromatin tend to be more abundant closer to genes, this trend is least pronounced for methylated, siRNA-targeted TE sequences located 5' to genes. Based on these and other findings, we propose that spreading of DNA methylation through promoter regions explains at least in part the negative impact of siRNA-targeted TE sequences on neighboring gene expression.


Figures
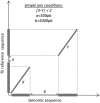
Figure 1.
Figure 1.
Schematic dot plot representation of ‘simple join’ conditions. Matching regions between genomic and TE reference sequence are represented by diagonals. Note that these regions might be fragments already connected by MATCHER. X and Y indicate percentage of identity to the TE reference sequence. a and b refer to the length of non-matching DNA on the TE reference and genomic sequences, respectively.
Figure 2.
Figure 2.
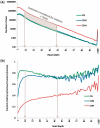
Read-depth coverage map of whole-genome bisulphite sequencing dataset (5). (a) The x-axis shows the number of bisulphite sequencing reads at a given cytosine and the y-axis represents number of sites. Most cytosines in all three sequence contexts are covered by <10 reads. For our analysis, only those cytosines were considered for which read depths were between 10 and 50. This proportion, shown in grey, represents ∼32% of the original data in all three cytosine contexts. (b) Fraction of methyl-cytosines detected at a given sequencing coverage (Read depth). Read depths below 10 lead to an underestimation of methylated CHG and CHH sites, while read depths above 50 tend to be more often associated with methylated cytosines at all three types of sites.
Figure 3.
Figure 3.
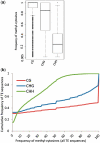
Frequency of methylated CG, CHG and CHH sites in TE sequences. (a) Boxplots showing frequency distribution of methyl-cytosines for TE sequences methylated for at least one type of site. Most of these TE sequences have almost all of their CG sites and a majority of their CHG sites methylated. (b) Frequency distribution of all TE sequences in relation to percentage of methylated sites, for each of the three types of sites.
Figure 4.
Figure 4.
DNA methylation patterns within TE superfamilies. Unmethylated TE sequences are found across all classes but >90% of the sequences for LTR/Gypsy and DNA/En-Spm superfamilies are methylated. The RC/Helitron and Tc1/mariner superfamilies comprise the largest fraction (50–60%) of unmethylated TE sequences.
Figure 5.
Figure 5.
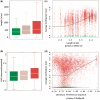
Relationships between DNA methylation, size, CpG content and divergence of TE sequences. Color code is as in Figure 4. (a) Unmethylated TE sequences tend to be smaller than their methylated counterparts. (b) Boxplots showing observed versus expected CpGs for the three DNA methylation patterns considered. Unmethylated TE sequences are depleted in CpGs compared to poorly methylated TEs (P-value = 0.004793, Wilcoxon rank-sum test) or methylated TEs (P-value < 1 e − 10). Poorly methylated TE sequences also have a lower CG content compared to methylated TE sequences (P-value = 5.369 e − 13). (c and d) Average methylation levels of TE sequences are plotted according to length or percentage of identity with the TE reference sequence. Significant positive correlation (black curve) is observed in each case.
Figure 6.
Figure 6.
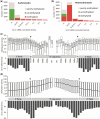
Relationship between methylated TE sequences and 24-nt siRNAs. (a) Methylated euchromatic TE sequences are almost always associated with an abundance of siRNAs. (b) A significant number of heterochromatic TE sequences are methylated but not associated with siRNAs (c) Methylated hetrochromatic TE sequences (size >200 bp) not associated with siRNAs but flanked within 1 kb on one or both sides by sequences associated with siRNAs. These TE sequences were split in half and DNA methylation densities were calculated in 100-bp windows along the two flanks and TE sequence halves by dividing the number of reads indicative of methylation at CG, CHG and CHH sites by the total number of cytosine-covering reads. Results are shown as boxplots of DNA methylation densities. Average normalized siRNA densities are also indicated for each 100-bp window. DNA methylation densities are uniform along the 1 kb flanks, but decrease progressively within the first 500 bp of TE sequences from both sides. (d) TE sequences associated with 24-nt siRNAs show increasing methylation from their extremities and decreasing methylation in their flanks.
Figure 7.
Figure 7.
Analysis of methylation spreading for CG, CHG and CHH sites. The figures in the first and second columns correspond to wild type (Col0) and the drm1, drm2, cmt3 triple mutant (ddc), respectively.
Figure 8.
Figure 8.
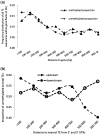
Distance between TE sequences and genes in euchromatin. (a) Both methylated and unmethylated TE sequences tend to accumulate close to genes. Note that because results do not substantially differ for the 5′- and 3′-ends of genes, they are not distinguished in the figure. (b) The proportion of unmethylated to total TE sequences drops slightly farther away from the 5′-end of genes. No similar drop is observed from the 3′-end of genes. Only the TE sequence closest to the start or stop codon was considered for this analysis.

Similar articles

Cited by

References

    1. Slotkin RK, Martienssen R. Transposable elements and the epigenetic regulation of the genome. Nat. Rev. Genet. 2007;8:272–285. - PubMed
    1. Law JA, Jacobsen SE. Establishing, maintaining and modifying DNA methylation patterns in plants and animals. Nat. Rev. Genet. 2010;11:204–220. - PMC - PubMed
    1. Teixeira FK, Colot V. Repeat elements and the Arabidopsis DNA methylation landscape. Heredity. 2010;105:14–23. - PubMed
    1. The Arabidopsis Genome Initiative. Analysis of the genome sequence of the flowering plant Arabidopsis thaliana. Nature. 2000;408:796–815. - PubMed
    1. Cokus SJ, Feng S, Zhang X, Chen Z, Merriman B, Haudenschild CD, Pradhan S, Nelson SF, Pellegrini M, Jacobsen SE. Shotgun bisulphite sequencing of the Arabidopsis genome reveals DNA methylation patterning. Nature. 2008;452:215–219. - PMC - PubMed

Publication types