. 2011 Jul 15;71(14):5020-9.
doi: 10.1158/0008-5472.CAN-11-0908. Epub 2011 May 17.

STAT3 plays a critical role in KRAS-induced pancreatic tumorigenesis

Affiliations

STAT3 plays a critical role in KRAS-induced pancreatic tumorigenesis

Ryan B Corcoran et al. Cancer Res. .

Abstract

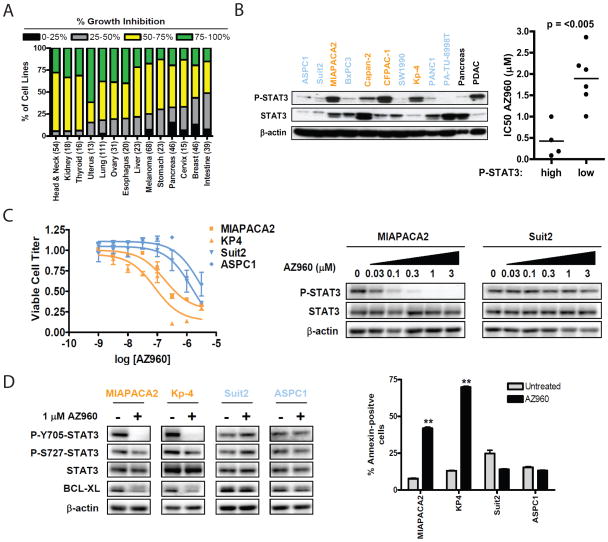
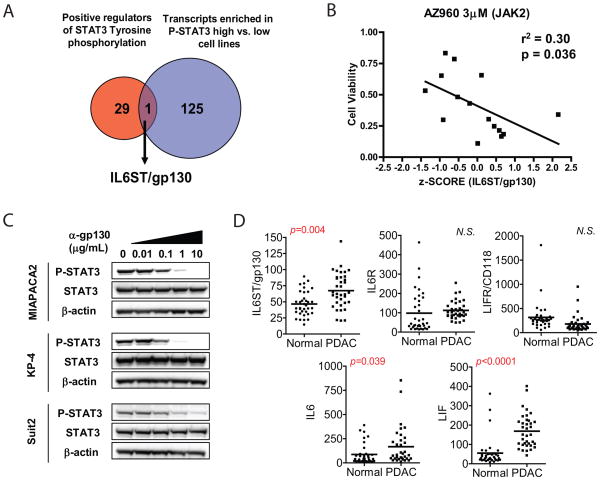
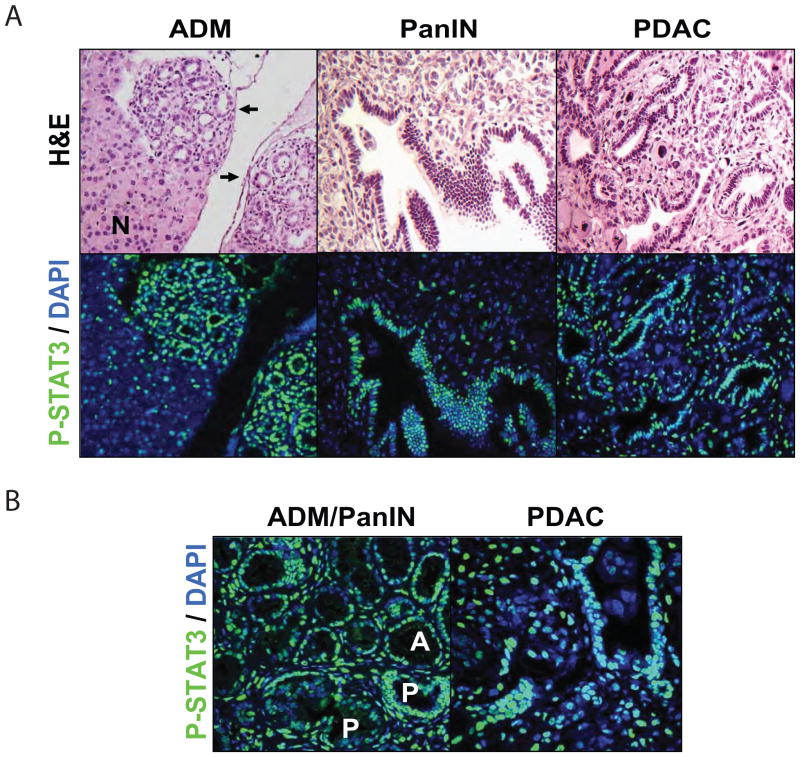
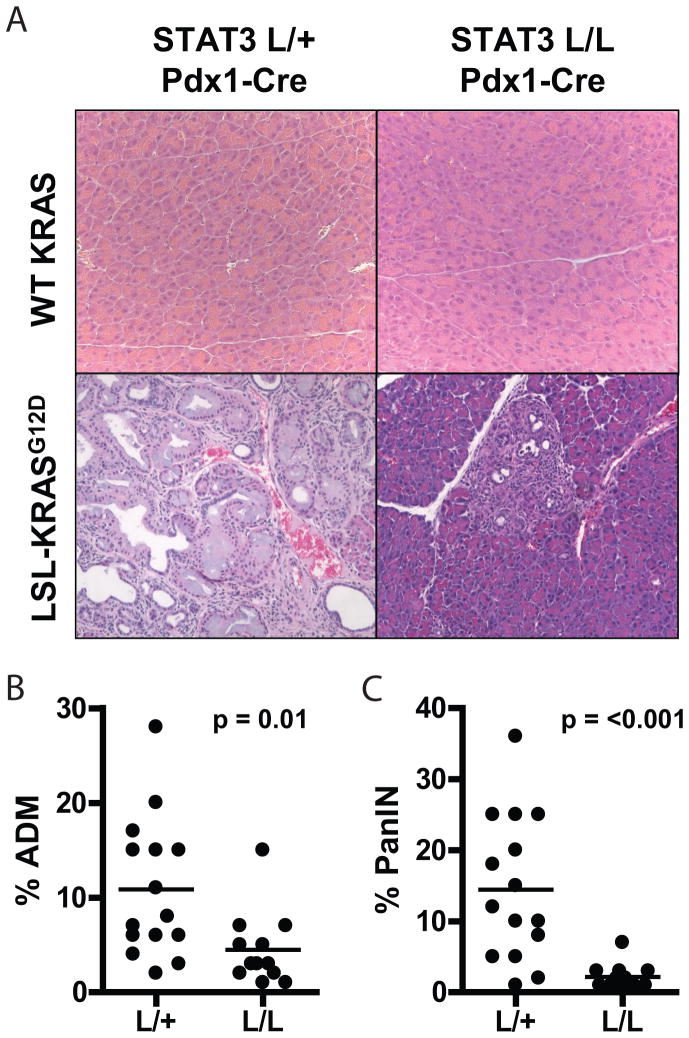
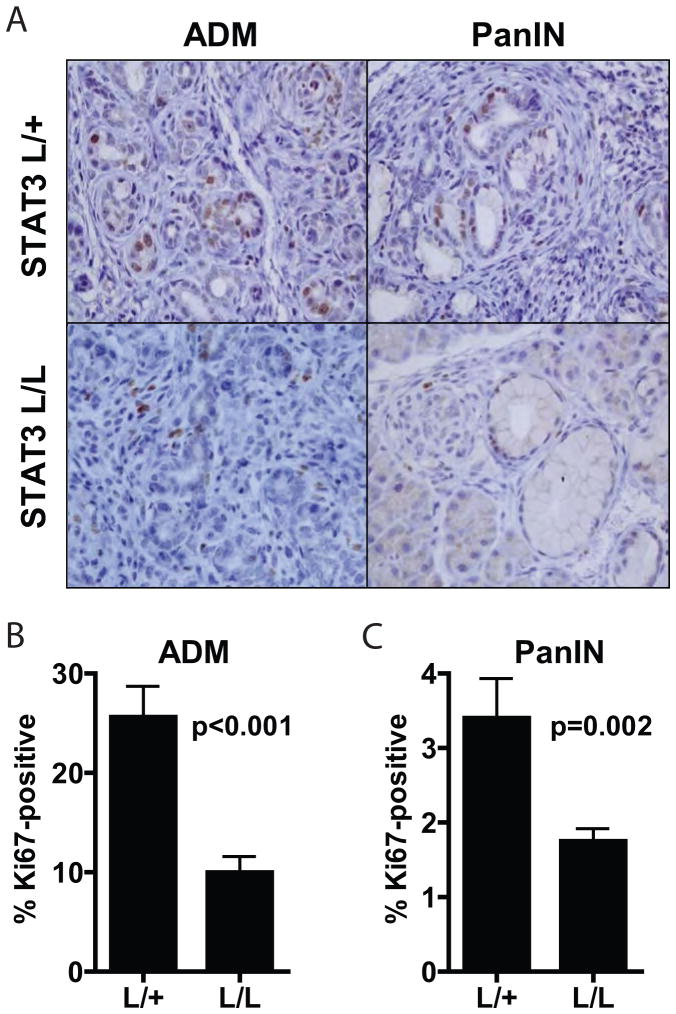
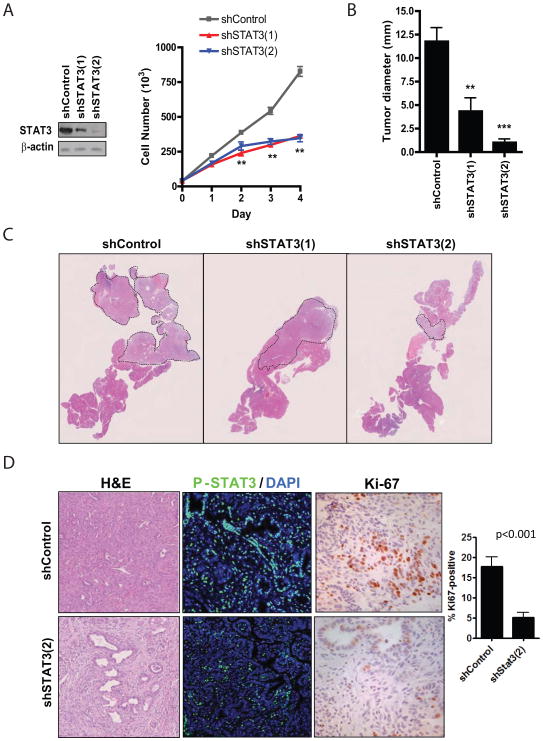
The STAT3 transcription factor is an important regulator of stem cell self-renewal, cancer cell survival, and inflammation. In the pancreas, STAT3 is dispensable for normal development, whereas the majority of pancreatic ductal adenocarcinomas (PDAC) show constitutive activation of STAT3, suggesting its potential as a therapeutic target in this cancer. Here, we sought to define the mechanisms of STAT3 activation and its functional importance in PDAC pathogenesis. Large-scale screening of cancer cell lines with a JAK2 inhibitor that blocks STAT3 function revealed a more than 30-fold range in sensitivity in PDAC, and showed a close correlation of sensitivity with levels of tyrosine-phosphorylated STAT3 and of the gp130 receptor, an upstream signaling component. Correspondingly, upregulation of the IL6/LIF-gp130 pathway accounted for the strong STAT3 activation in PDAC subsets. To define functions of STAT3 in vivo, we developed mouse models that test the impact of conditional inactivation of STAT3 in KRAS-driven PDAC. We showed that STAT3 is required for the development of the earliest premalignant pancreatic lesions, acinar-to-ductal metaplasia (ADM) and pancreatic intraepithelial neoplasia (PanIN). Moreover, acute STAT3 inactivation blocked PDAC initiation in a second in vivo model. Our results show that STAT3 has critical roles throughout the course of PDAC pathogenesis, supporting the development of therapeutic approaches targeting this pathway. Moreover, our work suggests that gp130 and phospho-STAT3 expression may be effective biomarkers for predicting response to JAK2 inhibitors.


Figures

Fig. 1
Fig. 1. P-STAT3 levels predict sensitivity of PDAC cell lines to JAK2 inhibition
A, Analysis of the drug sensitivity profile of AZ960 (3μM) over a panel of >500 solid tumor cell lines based on tumor type (total number of cell lines in parenthesis). Bar color indicates percent growth inhibition relative to control. Bar height represents the percentage of cell lines of each tumor type showing the indicated degree of growth inhibition. B, left, western blot of P-STAT3 and total STAT3 levels in 10 PDAC cell lines, compared to normal pancreas and PDAC tissue. Right, comparison of the IC50 of AZ960 in PDAC cell lines with high vs. low P-STAT3 levels. Bar represents the mean IC50 value for each group. P-value is shown. C, left, PDAC cell lines with high (orange) or low (blue) P-STAT3 levels were treated in triplicate with the indicated concentrations of AZ960 for 72h. Viable cell titer was determined, and average values are shown relative to untreated controls for each cell line. Error bars represent SD for each measurement. Right, western blot of PDAC cell lines treated with the indicated concentrations of AZ960 for 24h. D, left, PDAC cell lines were treated in the presence or absence of 1μM AZ960 for 24h. Lysates were probed with the indicated antibodies. Right, PDAC cell lines were treated in the presence or absence of 1μM AZ960 for 72h. Percent apoptotic cells was determined by Annexin V staining (**p<0.01).
Fig. 2
Fig. 2. P-STAT3 is regulated by IL6 cytokine family signaling in PDAC cell lines
A, Gene expression micorarray data from P-STAT3 high and low PDAC lines were analyzed to identify transcripts differentially enriched in P-STAT3 high cell lines. 126 transcripts found to be enriched in P-STAT3 high cell lines were cross-referenced with 30 positive regulators of STAT3 tyrosine phosphorylation identified by gene ontology search. Only one gene, IL6ST (encoding gp130) was present in both data sets. B, IL6ST transcript level z-score for 15 PDAC cell lines was correlated with drug sensitivity data to 3μM AZ960 from a large cell line repository drug screen. P value and r2 value are shown. C, PDAC cell lines were treated for 24h with increasing concentrations of gp130-neutralizing antibody. Cell lysates were probed with the indicated antibodies. D, Gene expression microarray data from 36 human PDACs and matched normal pancreas controls (normal) were analyzed for expression of IL6 cytokine family members. Bars represent mean of each group. P values are shown (N.S., not significant).
Fig. 3
Fig. 3. STAT3 is phosphorylated at multiple stages of pancreatic tumorigenesis
A, ADM and late-stage PanIN tissue from Pdx1-Cre; LSL-KRASG12D mice and PDAC tissue from Pdx1-Cre; LSL-KRASG12D; p53+/− mice were analyzed for the presence of P-STAT3 (green) by immunofluoresence with DAPI nuclear counterstain (blue). After image capture, slides were stained with hematoxylin and eosin (H&E). Arrows indicate regions of ADM. Normal pancreas is indicated by (N). B, higher magnification images of P-STAT3 staining (green) in ADM (upper half of image, A) or early-stage PanIN (lower half of image, P) lesions or in PDAC are shown.
Fig. 4
Fig. 4. Loss of STAT3 decreases KRAS-induced ADM and PanIN formation
A, pancreatic tissue from 12 week-old Pdx1-Cre; STAT3lox/+ (L/+) or Pdx1-Cre; STAT3lox/lox (L/L) mice homozygous for wild-type KRAS alleles (upper panels) or heterozygous for the LSL-KRASG12D allele (lower panels) were harvested and stained with hematoxylin and eosin. B–C, the percent of each pancreas occupied by ADM (B) or PanIN (C) was calculated for each mouse. Each point represents a single mouse, and horizontal bars represent mean percentage for each group. P-values are shown.
Fig. 5
Fig. 5. ADM and PanIN lesions that form in the absence of STAT3 show decreased proliferation
A, pancreatic tissue from 12 week-old Pdx1-Cre; LSL-KRASG12D; STAT3lox/+ (L/+) or Pdx1-Cre; LSL-KRASG12D; STAT3lox/lox (L/L) mice was harvested and stained for Ki67. B-C, the percentage of Ki67-positive nuclei in ADM (B) or PanIN (C) lesions was calculated for each genotype, and mean percentage is shown. Error bars represent SD. P-values are shown.
Fig. 6
Fig. 6. STAT3 knockdown prevents PDAC initiation in vivo
A, KRAS-shp53 ductal cells were infected with the indicated shRNAs and analyzed by western blot (left panel) and by cell counting. Measurements were performed in triplicate, and average values are shown (**p<0.001). Error bars represent SD. B, Equal numbers of KRAS-shp53 ductal cells infected with the indicated shRNAs were injected orthotopically into the pancreata of recipient mice. After 4 weeks, pancreatic tissue was harvested and the maximum tumor diameter was determined. Values represent the average tumor diameter for each group, and error bars represent SD (**p<0.01, ***p<0.001). C, upper, low magnification view of sectioned pancreas from representative mice harvested as in C. Dashed lines outline tumor tissue. D, Representative images of orthotopic tumors expressing shControl or shSTAT3(2) analyzed by H&E staining (Left, 200x), immunofluorescence for P-STAT3 staining (Middle; green, P-STAT3, blue, DAPI nuclear counterstain), and immunohistochemical analysis of Ki-67 staining (Right, 400x). The percentage of Ki-67-positive nuclei represented in the graph; the great majority of Ki-67 staining was in the tumor epithelial cells, whereas only occasional stromal cells were Ki-67+.

Similar articles

Cited by

References

    1. Warshaw AL, Fernández-del Castillo C. Pancreatic carcinoma. N Engl J Med. 1992;326:455–65. - PubMed
    1. Hruban RH, van Mansfeld AD, Offerhaus GJ, van Weering DH, Allison DC, Goodman SN, et al. K-ras oncogene activation in adenocarcinoma of the human pancreas. A study of 82 carcinomas using a combination of mutant-enriched polymerase chain reaction analysis and allele-specific oligonucleotide hybridization. Am J Pathol. 1993;143:545–54. - PMC - PubMed
    1. Klimstra DS, Longnecker DS. K-ras mutations in pancreatic ductal proliferative lesions. Am J Pathol. 1994;145:1547–50. - PMC - PubMed
    1. Moskaluk CA, Hruban RH, Kern SE. p16 and K-ras gene mutations in the intraductal precursors of human pancreatic adenocarcinoma. Cancer Res. 1997;57:2140–3. - PubMed
    1. Rozenblum E, Schutte M, Goggins M, Hahn SA, Panzer S, Zahurak M, et al. Tumor-suppressive pathways in pancreatic carcinoma. Cancer Res. 1997 May 1;57(9):1731–4. - PubMed

Publication types

MeSH terms

Substances