

Deletion of a subgroup of ribosome-related genes minimizes hypoxia-induced changes and confers hypoxia tolerance
- PMID: 21586670
- PMCID: PMC3138337
- DOI: 10.1152/physiolgenomics.00232.2010
Deletion of a subgroup of ribosome-related genes minimizes hypoxia-induced changes and confers hypoxia tolerance
Abstract
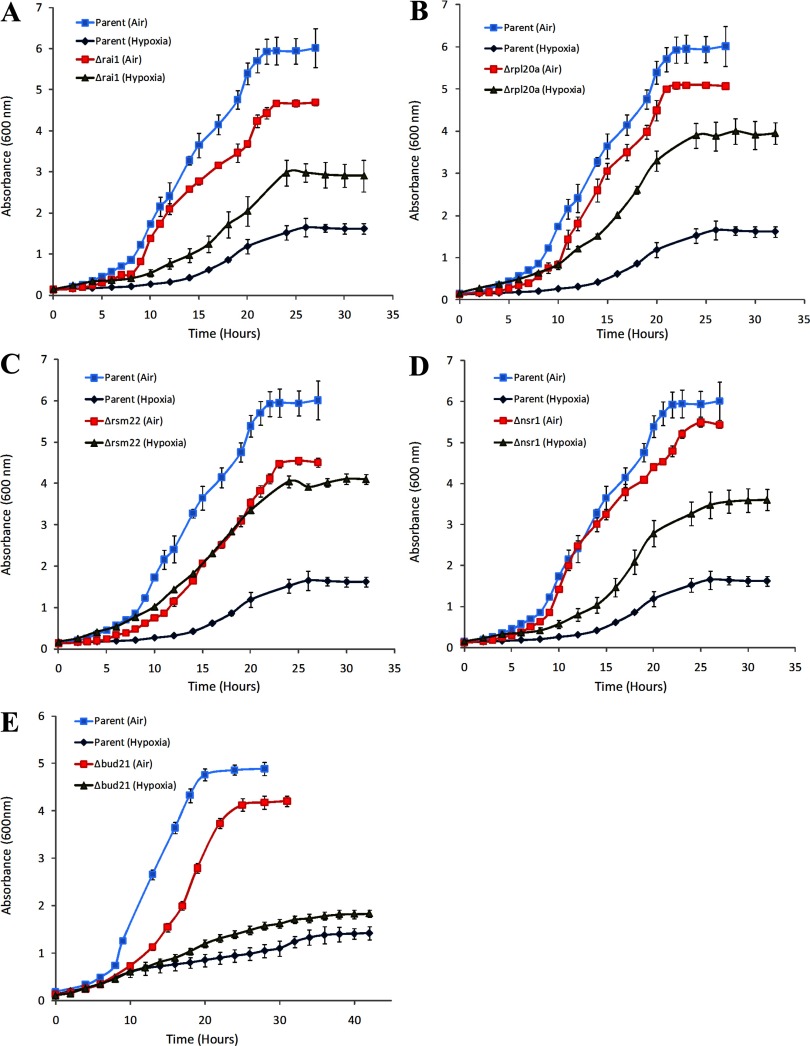
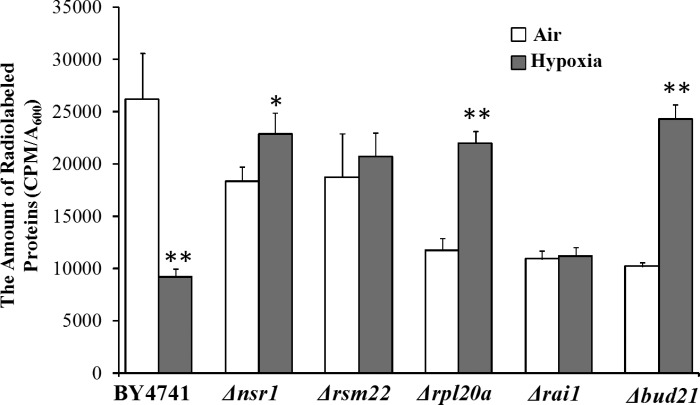
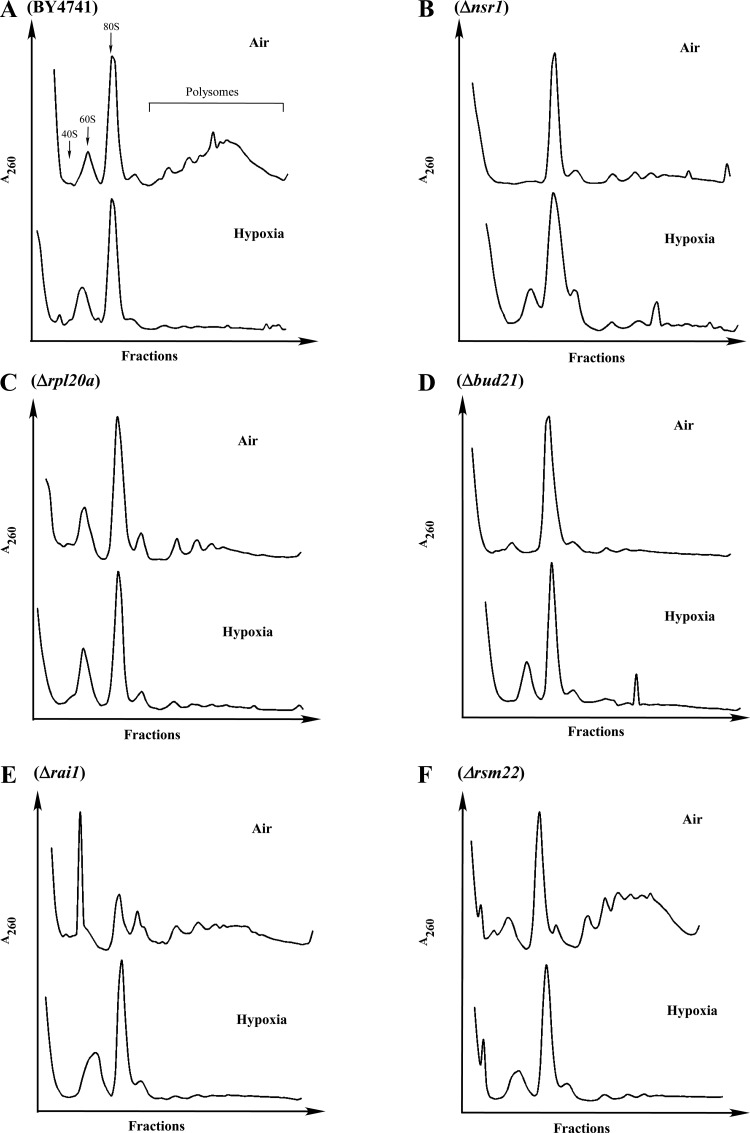
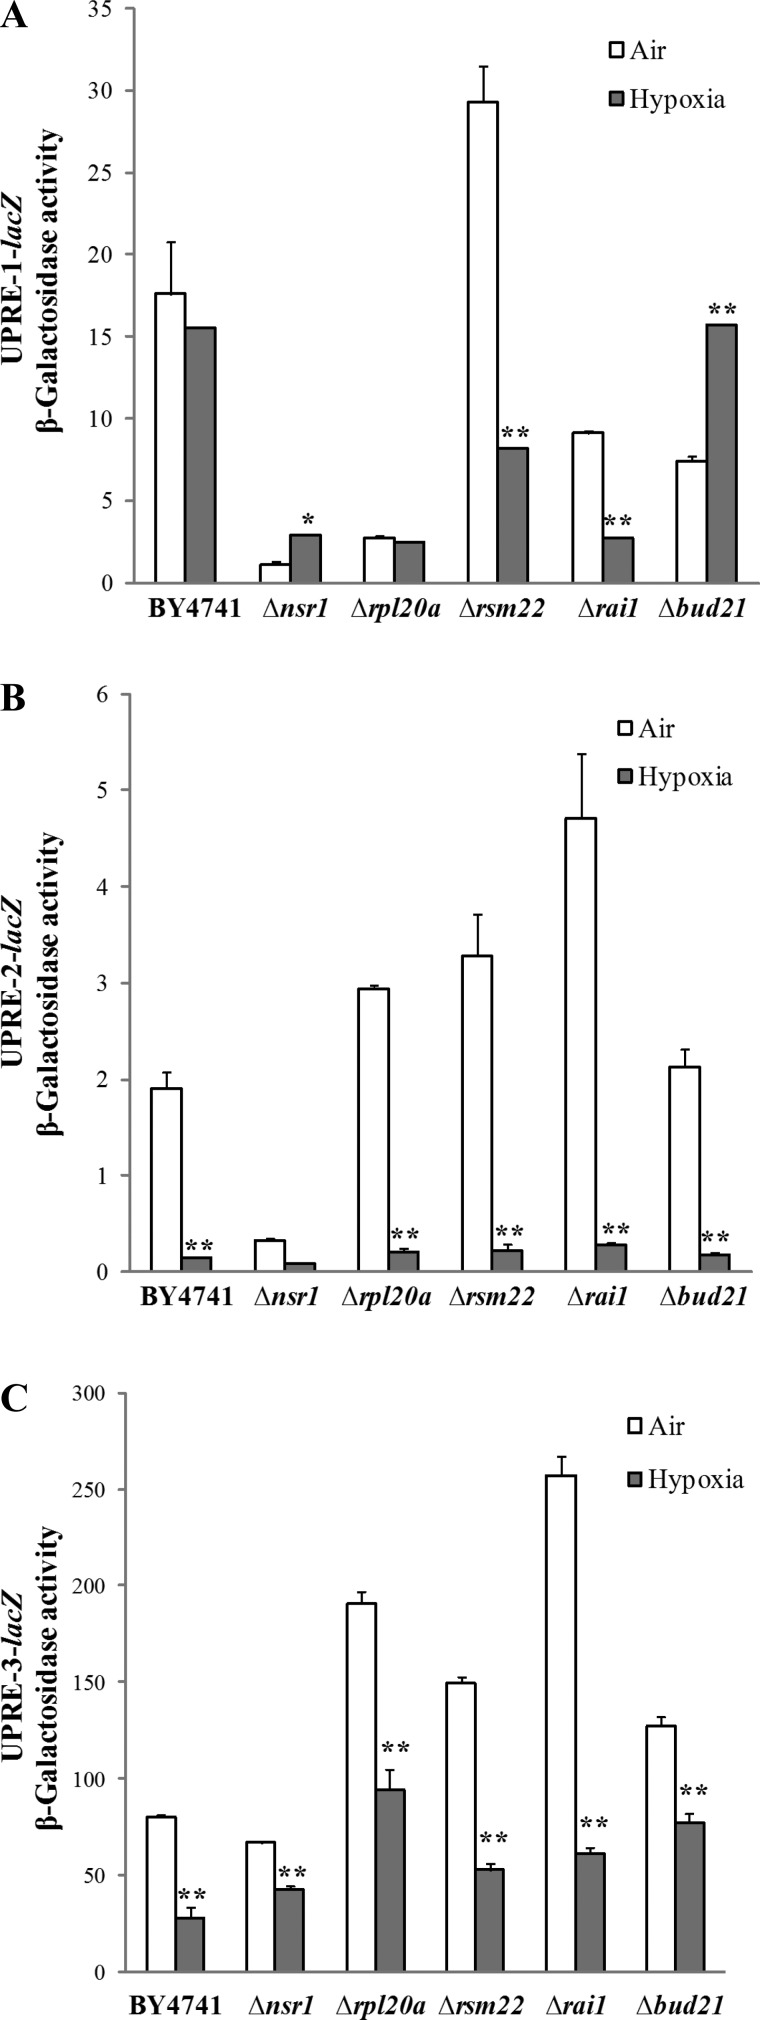
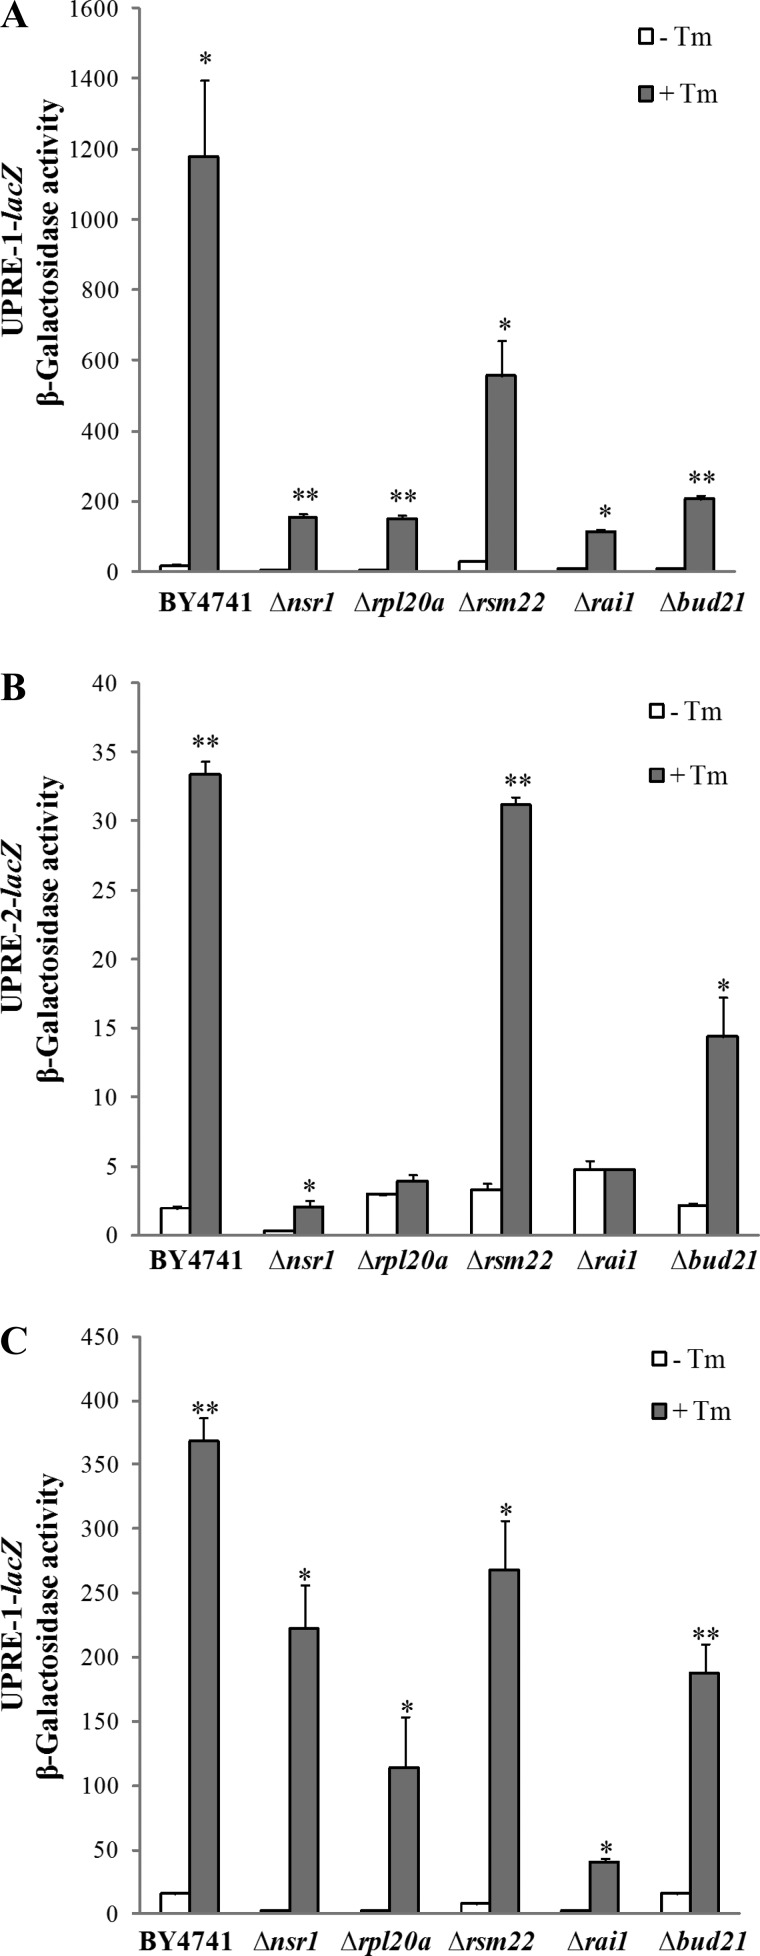
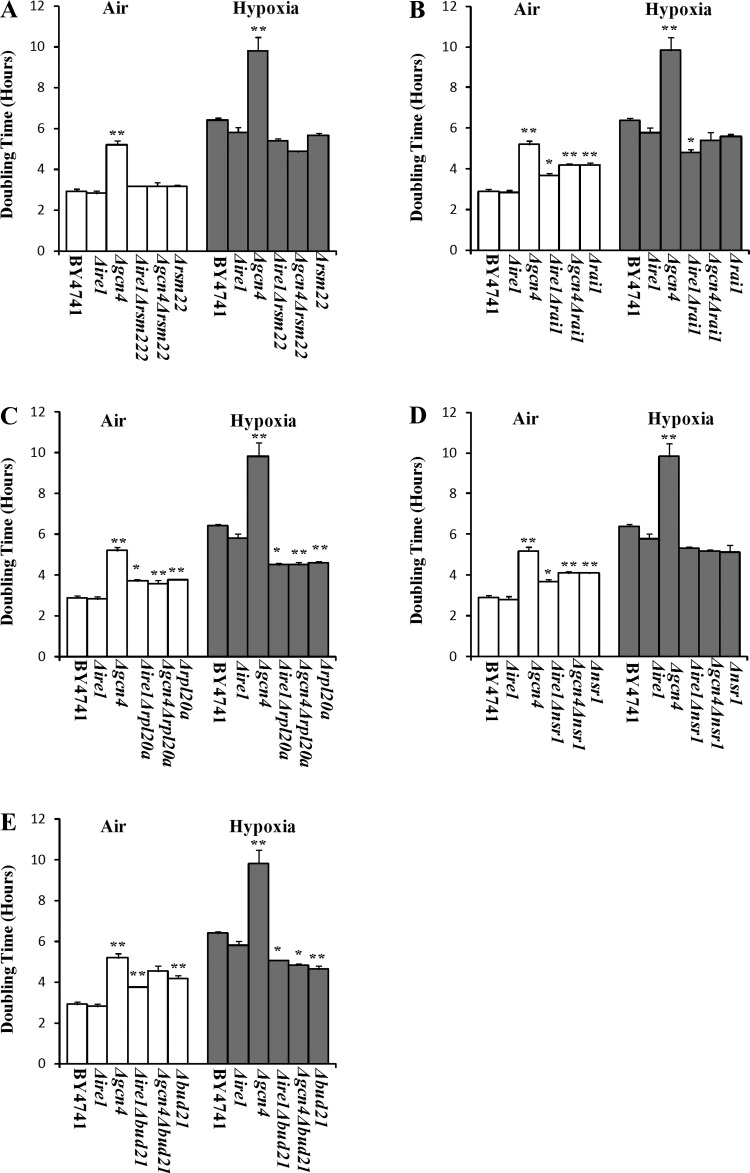
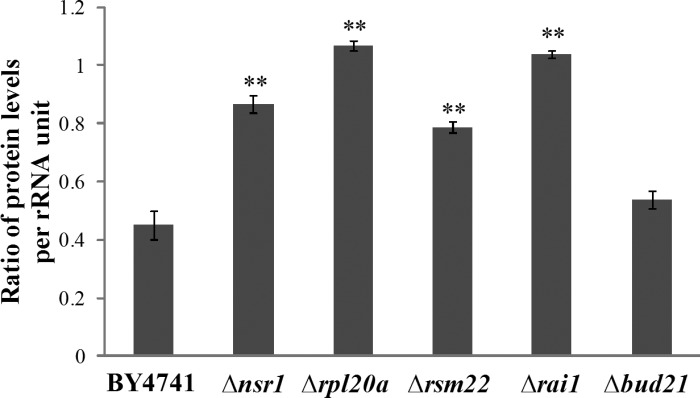
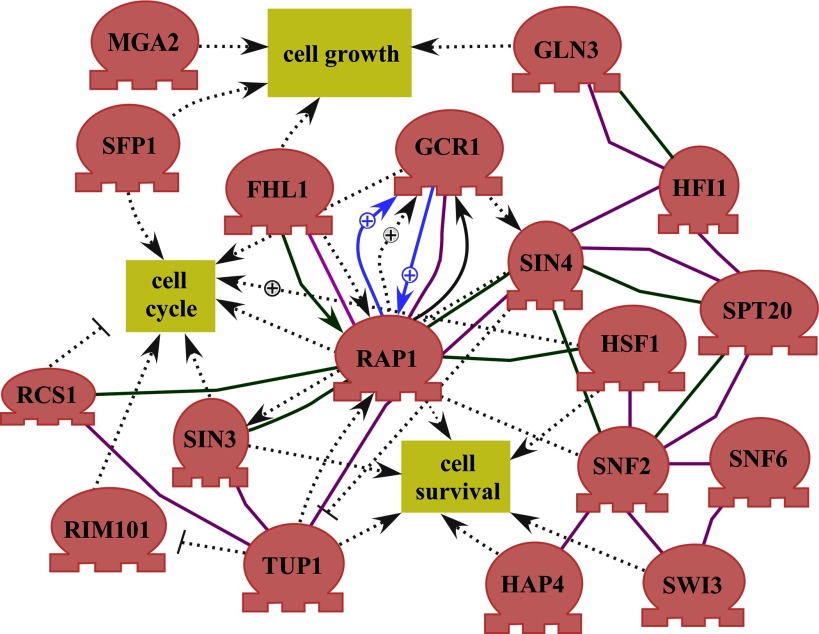
Hypoxia is a widely occurring condition experienced by diverse organisms under numerous physiological and disease conditions. To probe the molecular mechanisms underlying hypoxia responses and tolerance, we performed a genome-wide screen to identify mutants with enhanced hypoxia tolerance in the model eukaryote, the yeast Saccharomyces cerevisiae. Yeast provides an excellent model for genomic and proteomic studies of hypoxia. We identified five genes whose deletion significantly enhanced hypoxia tolerance. They are RAI1, NSR1, BUD21, RPL20A, and RSM22, all of which encode functions involved in ribosome biogenesis. Further analysis of the deletion mutants showed that they minimized hypoxia-induced changes in polyribosome profiles and protein synthesis. Strikingly, proteomic analysis by using the iTRAQ profiling technology showed that a substantially fewer number of proteins were changed in response to hypoxia in the deletion mutants, compared with the parent strain. Computational analysis of the iTRAQ data indicated that the activities of a group of regulators were regulated by hypoxia in the wild-type parent cells, but such regulation appeared to be diminished in the deletion strains. These results show that the deletion of one of the genes involved in ribosome biogenesis leads to the reversal of hypoxia-induced changes in gene expression and related regulators. They suggest that modifying ribosomal function is an effective mechanism to minimize hypoxia-induced specific protein changes and to confer hypoxia tolerance. These results may have broad implications in understanding hypoxia responses and tolerance in diverse eukaryotes ranging from yeast to humans.
Figures
Similar articles
-
Comparative transcriptome profiling analyses during the lag phase uncover YAP1, PDR1, PDR3, RPN4, and HSF1 as key regulatory genes in genomic adaptation to the lignocellulose derived inhibitor HMF for Saccharomyces cerevisiae.BMC Genomics. 2010 Nov 24;11:660. doi: 10.1186/1471-2164-11-660. BMC Genomics. 2010. PMID: 21106074 Free PMC article.
-
Proteomic analysis of the increased stress tolerance of saccharomyces cerevisiae encapsulated in liquid core alginate-chitosan capsules.PLoS One. 2012;7(11):e49335. doi: 10.1371/journal.pone.0049335. Epub 2012 Nov 9. PLoS One. 2012. PMID: 23152898 Free PMC article.
-
Endonucleolytic cleavage in the expansion segment 7 of 25S rRNA is an early marker of low-level oxidative stress in yeast.J Biol Chem. 2017 Nov 10;292(45):18469-18485. doi: 10.1074/jbc.M117.800003. Epub 2017 Sep 22. J Biol Chem. 2017. PMID: 28939771 Free PMC article.
-
Ribosome synthesis in Saccharomyces cerevisiae.Annu Rev Genet. 1999;33:261-311. doi: 10.1146/annurev.genet.33.1.261. Annu Rev Genet. 1999. PMID: 10690410 Review.
-
Yeast and human RNA helicases involved in ribosome biogenesis: current status and perspectives.Biochim Biophys Acta. 2013 Aug;1829(8):775-90. doi: 10.1016/j.bbagrm.2013.01.007. Epub 2013 Jan 26. Biochim Biophys Acta. 2013. PMID: 23357782 Review.
Cited by
-
The Swi3 protein plays a unique role in regulating respiration in eukaryotes.Biosci Rep. 2016 Jun 30;36(3):e00350. doi: 10.1042/BSR20160083. Print 2016 Jul. Biosci Rep. 2016. PMID: 27190130 Free PMC article.
-
The Profiles and Functions of RNA Editing Sites Associated with High-Altitude Adaptation in Goats.Int J Mol Sci. 2023 Feb 4;24(4):3115. doi: 10.3390/ijms24043115. Int J Mol Sci. 2023. PMID: 36834526 Free PMC article.
-
Comparative transcriptomic and metabolomics analysis of modified atmosphere responses in Tribolium castaneum (Coleoptera: Tenebrionidae).J Insect Sci. 2024 Mar 1;24(2):8. doi: 10.1093/jisesa/ieae015. J Insect Sci. 2024. PMID: 38491952 Free PMC article.
-
Re-evaluation of the impact of BUD21 deletion on xylose utilization by Saccharomyces cerevisiae.Metab Eng Commun. 2023 Jan 25;16:e00218. doi: 10.1016/j.mec.2023.e00218. eCollection 2023 Jun. Metab Eng Commun. 2023. PMID: 37398920 Free PMC article.
-
Hypoxia-induced gene expression results from selective mRNA partitioning to the endoplasmic reticulum.Nucleic Acids Res. 2015 Mar 31;43(6):3219-36. doi: 10.1093/nar/gkv167. Epub 2015 Mar 8. Nucleic Acids Res. 2015. PMID: 25753659 Free PMC article.
References
-
- Aggarwal K, Choe LH, Lee KH. Shotgun proteomics using the iTRAQ isobaric tags. Brief Funct Genomic Proteomic 5: 112–120, 2006. - PubMed
-
- Aragones J, Fraisl P, Baes M, Carmeliet P. Oxygen sensors at the crossroad of metabolism. Cell Metab 9: 11–22, 2009. - PubMed
-
- Aragones J, Schneider M, Van Geyte K, Fraisl P, Dresselaers T, Mazzone M, Dirkx R, Zacchigna S, Lemieux H, Jeoung NH, Lambrechts D, Bishop T, Lafuste P, Diez-Juan A, Harten SK, Van Noten P, De Bock K, Willam C, Tjwa M, Grosfeld A, Navet R, Moons L, Van dendriessche T, Deroose C, Wijeyekoon B, Nuyts J, Jordan B, Silasi-Mansat R, Lupu F, Dewerchin M, Pugh C, Salmon P, Mortelmans L, Gallez B, Gorus F, Buyse J, Sluse F, Harris RA, Gnaiger E, Hespel P, Van Hecke P, Schuit F, VanVeldhoven P, Ratcliffe P, Baes M, Maxwell P, Carmeliet P. Deficiency or inhibition of oxygen sensor Phd1 induces hypoxia tolerance by reprogramming basal metabolism. Nat Genet 40: 170–180, 2008. - PubMed
Publication types
MeSH terms
Substances
Grants and funding
LinkOut - more resources
Full Text Sources
Molecular Biology Databases
Miscellaneous