. 2011 Jul 14;118(2):289-97.
doi: 10.1182/blood-2010-12-327403. Epub 2011 May 17.

The identification and characterization of zebrafish hematopoietic stem cells

Affiliations

The identification and characterization of zebrafish hematopoietic stem cells

Dongdong Ma et al. Blood. .

Abstract

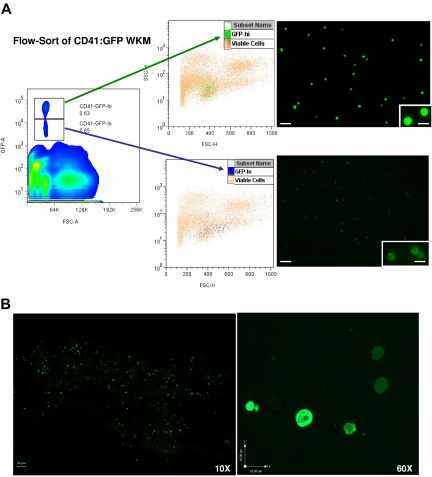
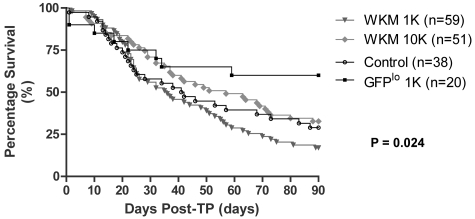
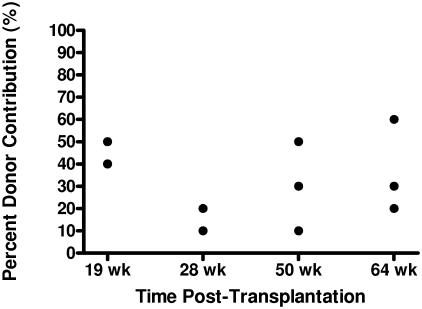
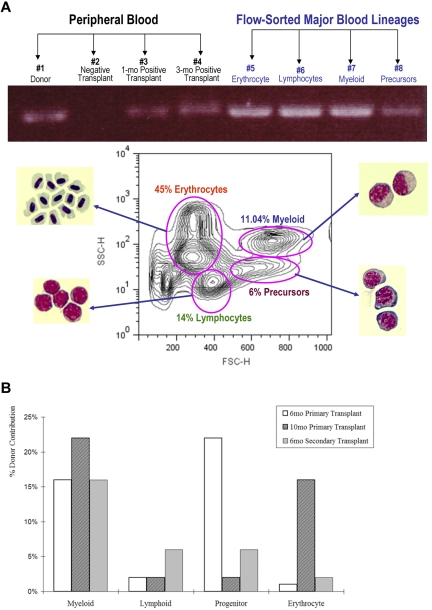
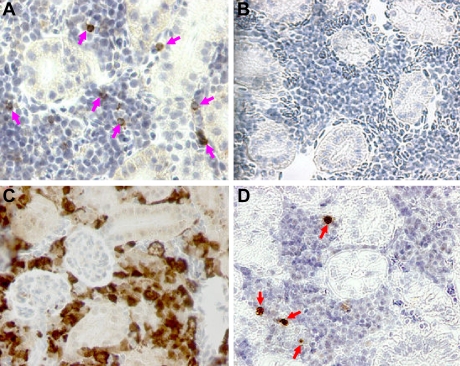
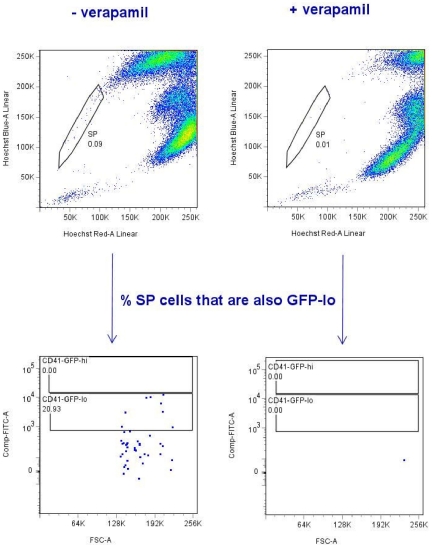
HSCs are defined by their ability to self-renew and maintain hematopoiesis throughout the lifespan of an organism. The optical clarity of their embryos and the ease of genetic manipulation make the zebrafish (Danio rerio) an excellent model for studying hematopoiesis. Using flow cytometry, we identified 2 populations of CD41-GFP(+) cells (GFP(hi) and GFP(lo)) in the whole kidney marrow of Tg(CD41:GFP) zebrafish. Past studies in humans and mice have shown that CD41 is transiently expressed in the earliest hematopoietic progenitors and is then silenced, reappearing in the platelet/thrombocyte lineage. We have transplanted flow-sorted GFP(hi) and GFP(lo) cells into irradiated adult zebrafish and assessed long-term hematopoietic engraftment. Transplantation of GFP(hi) cells did not reconstitute hematopoiesis. In contrast, we observed multilineage hematopoiesis up to 68 weeks after primary and secondary transplantation of GFP(lo) cells. We detected the CD41-GFP transgene in all major hematopoietic lineages and CD41-GFP(+) cells in histologic sections of kidneys from transplant recipients. These studies show that CD41-GFP(lo) cells fulfill generally accepted criteria for HSCs. The identification of fluorescent zebrafish HSCs, coupled with our ability to transplant them into irradiated adult recipients, provide a valuable new tool to track HSC homing, proliferation, and differentiation into hematopoietic cells.


Figures

Figure 1
Figure 1
Isolation of GFPhi and GFPlo cells from CD41-GFP transgenic zebrafish by flow cytometry. (A) The left panel shows the distribution of CD41-GFP+ cells in single-cell suspension of WKM derived from Tg(CD41:GFP) zebrafish. The frames outline the gatings used to define the CD41-GFPlo and CD41-GFPhi subsets. Viable cells were selected based on propidium iodide exclusion. FSC-A indicates forward scatter; and SSC-H, side scatter. The middle panels locate the CD41-GFPlo and CD41-GFPhi cells on scatter plots of viable cells derived from WKM. FSC-H indicates forward scatter; and GFP-A, GFP-positive. The right panels are fluorescent micrographs at 10× and 60× (inset) of flow-sorted CD41-GFPlo and CD41-GFPhi cells. (B) The direct visualization of CD41-GFPlo and CD41-GFPhi cells in the kidney of Tg(CD41-GFP) fish at 10× (scale bar = 50 μm) and 60× magnification (scale bar = 10 μm).
Figure 2
Figure 2
Ultrastructural morphology of CD41hi and CD41lo cells. Transmission electron microscopy of CD41hi cells (A, low magnification; B, high magnification) shows the key features of thrombocytes, including the characteristic surface-connected canalicular system and a cytoplasm packed with numerous small granules. Ultrastructural examination of CD41lo cells (C, low magnification; D, high magnification) shows an immature phenotype. Cells were generally homogeneous in appearance showing an irregular shape with small protrusions. Ribosomes and mitochondria were observed in the rim of cytoplasm surrounding the nucleus. However, these cells lacked the numerous granules observed in the more mature CD41hi thrombocytes. The nuclei were more irregular in shape and a prominent band of heterochromatin at the margin of the nucleus was observed in the majority of cells. The heterochromatin appears more fragmented through the nucleus and less marked at the margin. Scale: A,C: bar = 2 μm; B,D: bar = 1 μm.
Figure 3
Figure 3
Survival of irradiated zebrafish transplanted with unfractionated WKM or flow-sorted CD41-GFPlo cells calculated by the method of Kaplan and Meier. This figure depicts survival at 90 days of fish transplanted with either varying numbers of CD41-GFP WKM cells or flow-sorted CD41-GFPlo cells. Fish that were transplanted with 1000 CD41-GFPlo cells showed much higher survival rate compared with control and the cohorts of fish received varying numbers of unfractionated CD41-GFP WKM cells. The P value .024 is for the log-rank test that indicates the survival distributions are significantly different.
Figure 4
Figure 4
Donor chimerism in peripheral blood of transplanted recipients over time. The graph depicts the contribution of donor DNA to total genomic DNA in unfractionated peripheral blood cells sampled from zebrafish 19, 28, 50, and 64 weeks after transplantation with 103 CD41-GFPlo cells. Each round dot represents data from an individual recipient fish.
Figure 5
Figure 5
Multilineage reconstitution after transplantation of CD41-GFPlo cells into irradiated primary and secondary recipients. (A) The top panel analyzes donor-specific signals by PCR in the genomic DNA of unfractionated peripheral blood cells 1-3 months after transplantation and flow-sorted WKM cells 3 months after transplantation. The bottom panel depicts a plot of the forward and side scatter of WKM cells and the location, as determined by microscopic examination, of the major blood cell lineages. The pink ovals mark the windows for erythroid, myeloid, lymphoid, and various precursor populations in zebrafish WKM determined by examining Wright-Giemsa stains of cytospins derived from the flow-sorted cells. The percentages vary slightly with each WKM preparation but the ones shown here are representative. FSC-H indicates forward scatter; and SSC-H, side scatter. The bar chart in panel B shows the percentage of total genomic DNA extracted from flow-sorted cells that contains the donor-specific signal (GFP) gated according to the windows depicted in panel A. Two fish per group were examined 6 and 10 months after primary transplantation and 6 months after secondary transplantation. As shown, the donor contribution percentage varied among lineages, with time after transplantation and among individual fish.
Figure 6
Figure 6
Immunohistochemical staining of sections of zebrafish kidney with anti-GFP Ab. Staining was performed on paraffin-embedded kidney sections using a 1:1500 dilution of anti-GFP Ab and peroxidase-conjugated secondary Ab. Brown-staining cells were observed in panels A, C, and D. (A) In donor Tg(CD41:GFP) kidney, representative CD41-GFP+ cells are indicated by pink arrows. (B) In wild-type untransplanted fish, there was no staining detected. (C) Irradiated fish that were transplanted with 0.5 × 10⁶ β-actin:GFP+ cells from Tg(β-actin:GFP) WKM showed engrafted cells of multiple lineages throughout the renal tubules and interstitium, as exhibited by brown signals galore in the kidney section. (D) In transplanted fish that received 103 flow-sorted CD41-GFPlo cells, engrafted cells were marked by red arrows in the hematopoietic cell portion of the recipient kidney.
Figure 7
Figure 7
Side population (SP) cells from Tg(CD41:GFP) zebrafish overlaps with CD41-GFPlo subpopulation. The top panel flow cytometric diagrams show typical SP profile derived from lymphocyte and progenitor subsets of CD41-GFP WKM cells after incubation with the Hoechst 33342 dye in presence (on the right) or absence of verapamil (on the left). Vertical axis shows blue Hoechst fluorescence; horizontal axis shows red Hoechst fluorescence. The SP cells are indicated within the gate. The lower 2 panels indicate the percentage of SP cells that are also CD41-GFPlo. Here the vertical axis shows FITC fluorescence; horizontal axis shows forward scatter. Two gates mark CD41-GFPlo and CD41-GFPhi subsets, respectively. The SP cells overlap with CD41-GFPlo by > 20%.

References

    1. McCulloch EA, Till JE. The sensitivity of cells from normal mouse bone marrow to gamma radiation in vitro and in vivo. Radiat Res. 1962;16:822–832. - PubMed
    1. Till JE, Mc CE. A direct measurement of the radiation sensitivity of normal mouse bone marrow cells. Radiat Res. 1961;14:213–222. - PubMed
    1. McCulloch EA, Till JE. The radiation sensitivity of normal mouse bone marrow cells, determined by quantitative marrow transplantation into irradiated mice. Radiat Res. 1960;13:115–125. - PubMed
    1. Weissman IL, Heimfeld S, Spangrude G. Haemopoietic stem cell purification. Immunol Today. 1989;10(6):184–185. - PubMed
    1. van de Rijn M, Heimfeld S, Spangrude GJ, Weissman IL. Mouse hematopoietic stem-cell antigen Sca-1 is a member of the Ly-6 antigen family. Proc Natl Acad Sci U S A. 1989;86(12):4634–4638. - PMC - PubMed

Publication types

MeSH terms

Substances