

MRI-based polymer gel dosimetry for validating plans with multiple matrices in Gamma Knife stereotactic radiosurgery
- PMID: 21587176
- PMCID: PMC5718689
- DOI: 10.1120/jacmp.v12i2.3333
MRI-based polymer gel dosimetry for validating plans with multiple matrices in Gamma Knife stereotactic radiosurgery
Abstract
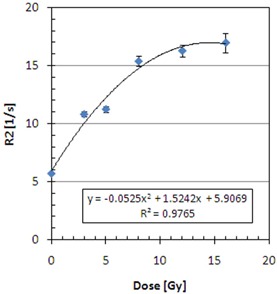
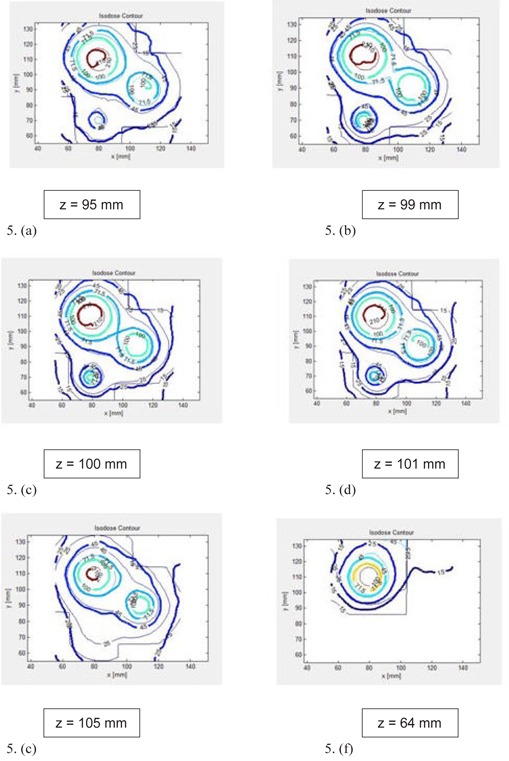
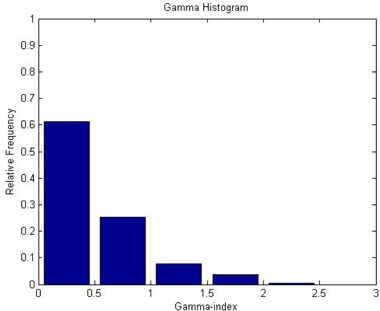
One of treatment planning techniques with Leksell GammaPlan (LGP) for Gamma Knife stereotactic radiosurgery (GKSRS) uses multiple matrices with multiple dose prescriptions. Computational complexity increases when shots are placed in multiple matrices with different grid sizes. Hence, the experimental validation of LGP calculated dose distributions is needed for those cases. For the current study, we used BANG3 polymer gel contained in a head-sized glass bottle to simulate the entire treatment process of GKSRS. A treatment plan with three 18 mm shots and one 8 mm shot in separate matrices was created with LGP. The prescribed maximum dose was 8 Gy to three shots and 16 Gy to one of the 18 mm shots. The 3D dose distribution recorded in the gel dosimeter was read using a Siemens 3T MRI scanner. The scanning parameters of a CPMG pulse sequence with 32 equidistant echoes were as follows: TR = 7 s, echo step = 13.6 ms, field-of-view = 256 mm × 256 mm, and pixel size = 1 mm × 1 mm. Interleaved acquisition mode was used to obtain 15 to 45 2-mm-thick slices. Using a calibration relationship between absorbed dose and the spin-spin relaxation rate (R2), we converted R2 images to dose images. MATLAB-based in-house programs were used for R2 estimation and dose comparison. Gamma-index analysis for the 3D data showed gamma values less than unity for 86% of the voxels. Through this study we accomplished the first application of polymer gel dosimetry for a true comparison between measured 3D dose distributions and LGP calculations for plans using multiple matrices for multiple targets.
Figures


References
-
- Lindquist C. Gamma knife radiosurgery. Semin Radiat Oncol. 1995;5(3):197–202. - PubMed
-
- Ibbott GS, Maryanski MJ, Eastman P. Three‐dimensional visualization and measurement of conformal dose distributions using magnetic resonance imaging of BANG polymer gel dosimeters. Int J Radiat Oncol Biol Phys. 1997;38(5):1097–103. - PubMed
-
- Ertl A, Berg A, Zehetmayer M, Frigo P. High‐resolution dose profile studies based on MR imaging with polymer BANG™ gels in stereotactic radiation techniques. Magn Reson Imaging. 2000;18(3):343–49. - PubMed
-
- Novotny J, Jr. , Novotny J, Spevacek V. Application of polymer gel dosimetry in gamma knife radiosurgery. J Neurosurg. 2002;97(5 Suppl):556–62. - PubMed
-
- Watanabe Y, Perera GM, Mooij RB. Image distortion in MRI‐based polymer gel dosimetry of gamma knife stereotactic radiosurgery systems. Med Phys. 2002;29(5):797–802. - PubMed
Publication types
MeSH terms
Substances
LinkOut - more resources
Full Text Sources
Medical
