. 2011 Jan 31;12(2):3346.
doi: 10.1120/jacmp.v12i2.3346.

Evaluation of a new VMAT QA device, or the "X" and "O" array geometries

Affiliations

Evaluation of a new VMAT QA device, or the "X" and "O" array geometries

Vladimir Feygelman et al. J Appl Clin Med Phys. .

Abstract

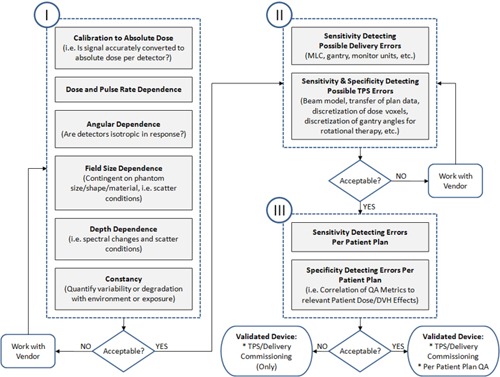
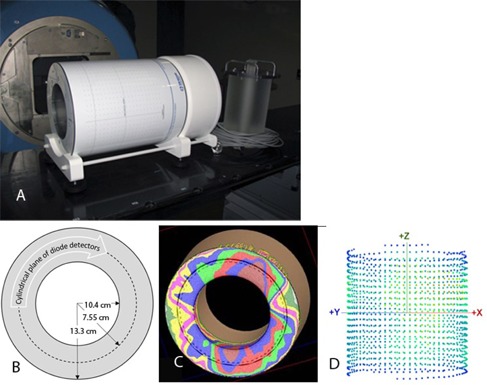
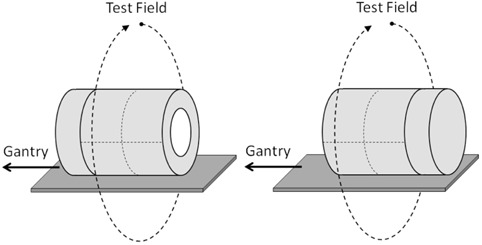
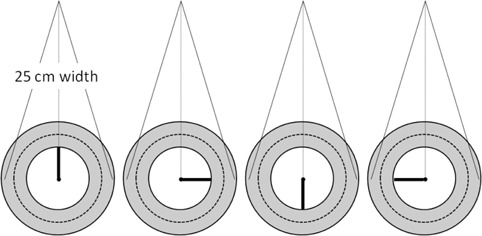
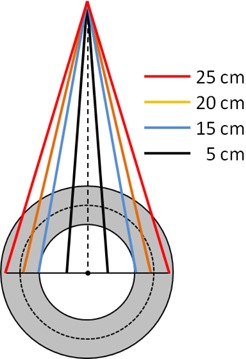
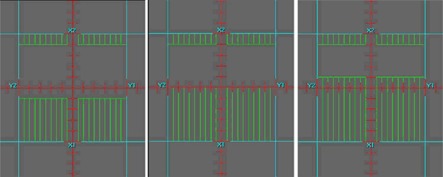
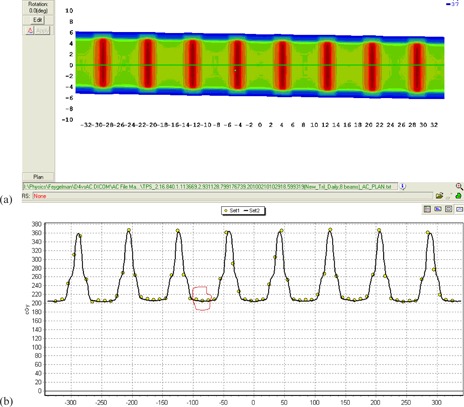
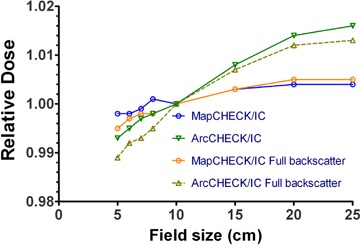
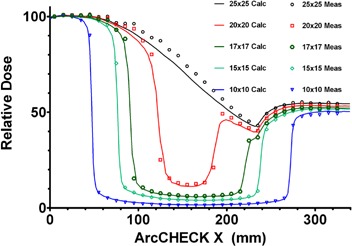
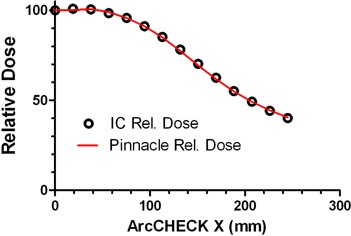
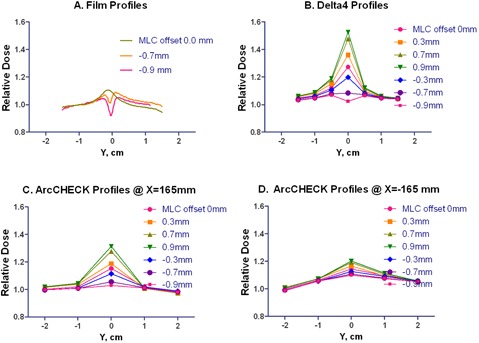
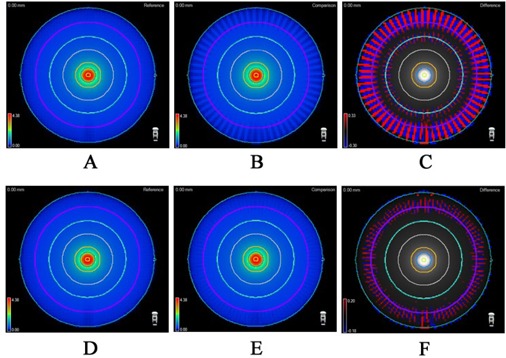
We introduce a logical process of three distinct phases to begin the evaluation of a new 3D dosimetry array. The array under investigation is a hollow cylinder phantom with diode detectors fixed in a helical shell forming an "O" axial detector cross section (ArcCHECK), with comparisons drawn to a previously studied 3D array with diodes fixed in two crossing planes forming an "X" axial cross section (Delta⁴). Phase I testing of the ArcCHECK establishes: robust relative calibration (response equalization) of the individual detectors, minor field size dependency of response not present in a 2D predecessor, and uncorrected angular response dependence in the axial plane. Phase II testing reveals vast differences between the two devices when studying fixed-width full circle arcs. These differences are primarily due to arc discretization by the TPS that produces low passing rates for the peripheral detectors of the ArcCHECK, but high passing rates for the Delta⁴. Similar, although less pronounced, effects are seen for the test VMAT plans modeled after the AAPM TG119 report. The very different 3D detector locations of the two devices, along with the knock-on effect of different percent normalization strategies, prove that the analysis results from the devices are distinct and noninterchangeable; they are truly measuring different things. The value of what each device measures, namely their correlation with--or ability to predict--clinically relevant errors in calculation and/or delivery of dose is the subject of future Phase III work.


Figures

Figure 1
Figure 1
General flow chart for validating a new 3D dosimetry phantom with intended use for: 1) commissioning TPS and delivery systems, and/or 2) per‐patient plan dose QA. There are three serial phases of validation testing.
Figure 2
Figure 2
The 3D dosimetry device: (a) overview with an optional PMMA plug on the right; (b) axial cross section of phantom and detector geometry; (c) rotational plan calculated on the virtual model of the device; and (d) 3D view of the diode detector positions, as seen from a 45° gantry angle.
Figure 3
Figure 3
Schematic of the Phase I detector flip test.
Figure 4
Figure 4
Schematic of the Phase I rotisserie test.
Figure 5
Figure 5
Schematic of the angular dependency tests using beam divergence to generate varying incidence angles. This also represents the setup for the field size dependence test.
Figure 6
Figure 6
MLC segments comprising the upper half of the split beam used in the split‐filed IMRT test. The overlap region is spread ±1cm around the central axis. The bottom half segments are a mirror image with respect to the central axis.
Figure 7
Figure 7
A dose distribution from the eight 10×10cm2 beams (a) and a profile along the ArcCHECK X direction (b) illustrating the detector selection for the output correction procedure. The three detector rows in each valley were used; one such set is circled for clarity. The circles on (b) represent diode readings, and the solid line is the dose profile predicted by the TPS.
Figure 8
Figure 8
Field‐size dependence variation shown by the ratios of diode to Farmer chamber readings for different field sizes and for different scatter conditions.
Figure 9
Figure 9
Measured and calculated relative ArcCHECK half‐profiles for field sizes from 10×10 to 25×25cm2.
Figure 10
Figure 10
Relative ion chamber and Pinnacle TPS calculated doses in the cylindrical Cheese phantom for a 25×25cm2 open field.
Figure 11
Figure 11
Longitudinal profiles with film, Delta and ArcCHECK (X=±165mm). The MLC offset varied from 0.0 to 0.9mm for the film and from 0.9 to 0.9 mm for the diode arrays. For the ArcCHECK, X = ±165mm correspond to the CAX beam entry points for lateral beams.
Figure 12
Figure 12
3D comparisons of a simple continuous arc delivery, discretized into static beams for calculation: (a) 2° spacing; (b) 6° spacing; (c) the regions of dose differences >1% (6° ‐ 2°); (d) 2° spacing; (e) 4° spacing; F) the regions of dose differences >1% (4° ‐ 2°). The purple ring represents the ArcCHECK detector surface.
Figure 13
Figure 13
Percent change in calculated dose with the arc width change of 1 mm on each side. Isocenter dose (representative of Delat 4 ) compared with the ArcCHECK detector location (10.4 cm from isocenter).
Figure 14
Figure 14
Measured and calculated dose profiles on the curved detector plane for a variety of arc aperture widths. For calculations, dose grid resolution was set at 3 mm and angular discretization varied from 2° to 6°. As evident from the graphs, the calculation dose grid resolution is adequate to demonstrate the discretization effect, while maintaining reasonable calculation times.

References

    1. Intensity Modulated Radiation Therapy Collaborative Working Group . Intensity‐modulated radiotherapy: current status and issues of interest. Int J Radiat Oncol Biol Phys. 2001;51(4):880–914. - PubMed
    1. Agazaryan N, Solberg TD, DeMarco JJ. Patient specific quality assurance for the delivery of intensity modulated radiotherapy. J Appl Clin Med Phys. 2003;4(1):40–50. - PMC - PubMed
    1. Bedford JL, Childs PJ, Warrington AP. Verification of inverse planning and treatment delivery for segmental IMRT. J Appl Clin Med Phys. 2004;5(2):1–17. - PMC - PubMed
    1. Childress NL, White RA, Bloch C, Salehpour M, Dong L, Rosen II. Retrospective analysis of 2D patient‐specific IMRT verifications. Med Phys. 2005;32(4):838–50. - PubMed
    1. Ezzell GA, Galvin JM, Low D, et al. Guidance document on delivery, treatment planning, and clinical implementation of IMRT: report of the IMRT Subcommittee of the AAPM Radiation Therapy Committee. Med Phys. 2003;30(8):2089–115. - PubMed

LinkOut - more resources