. 2011 May 17;30(13):2690-704.
doi: 10.1038/emboj.2011.163.

Id2 expression delineates differential checkpoints in the genetic program of CD8α+ and CD103+ dendritic cell lineages

Affiliations

Id2 expression delineates differential checkpoints in the genetic program of CD8α+ and CD103+ dendritic cell lineages

Jacob T Jackson et al. EMBO J. .

Abstract

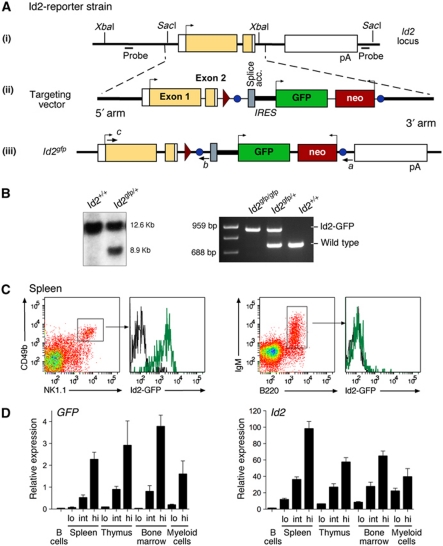
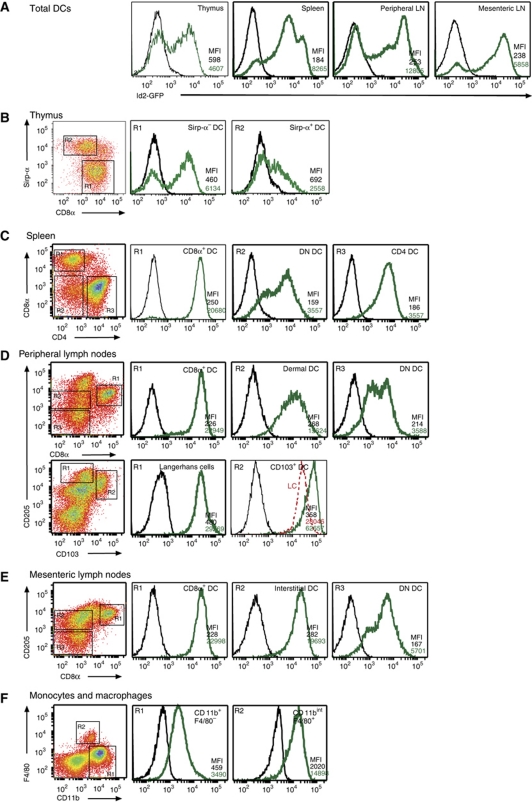
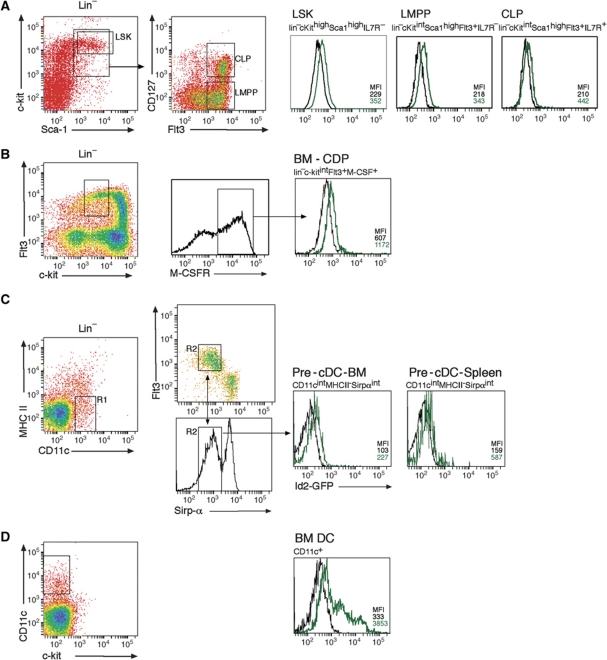
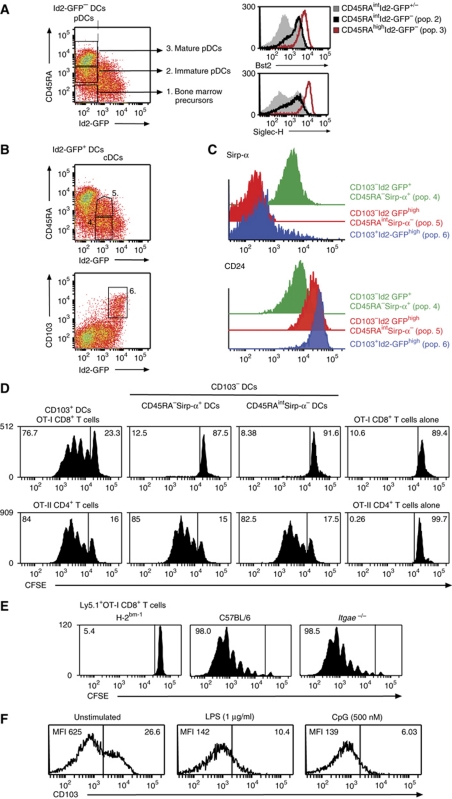
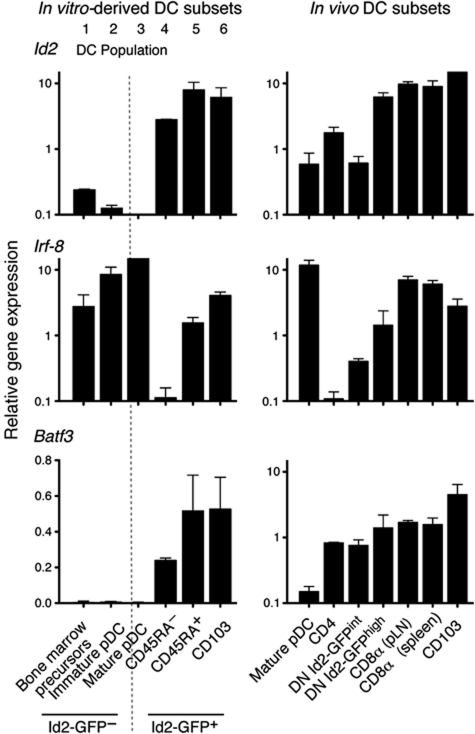
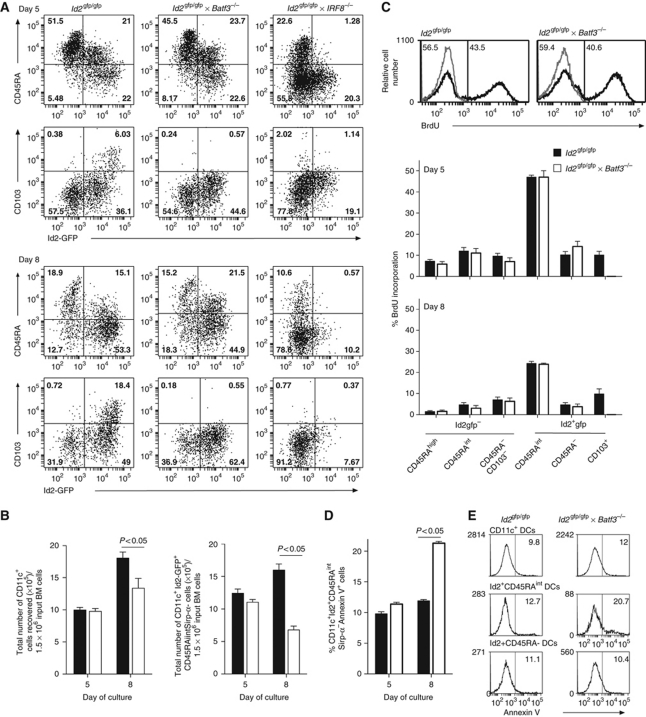
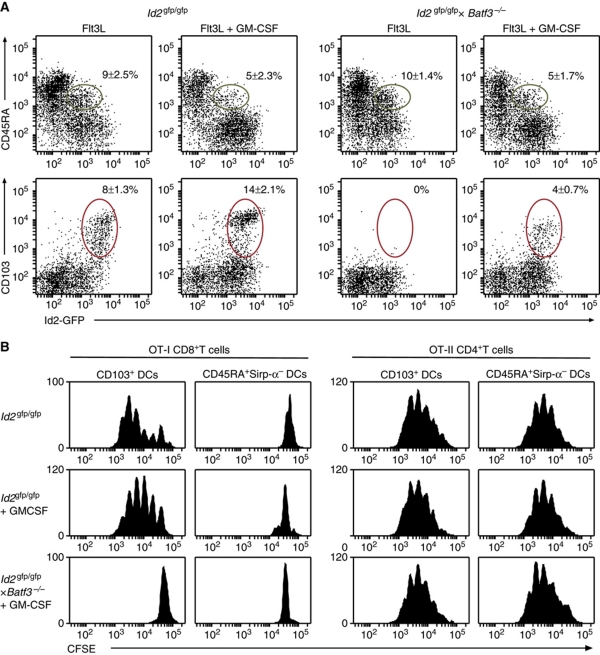
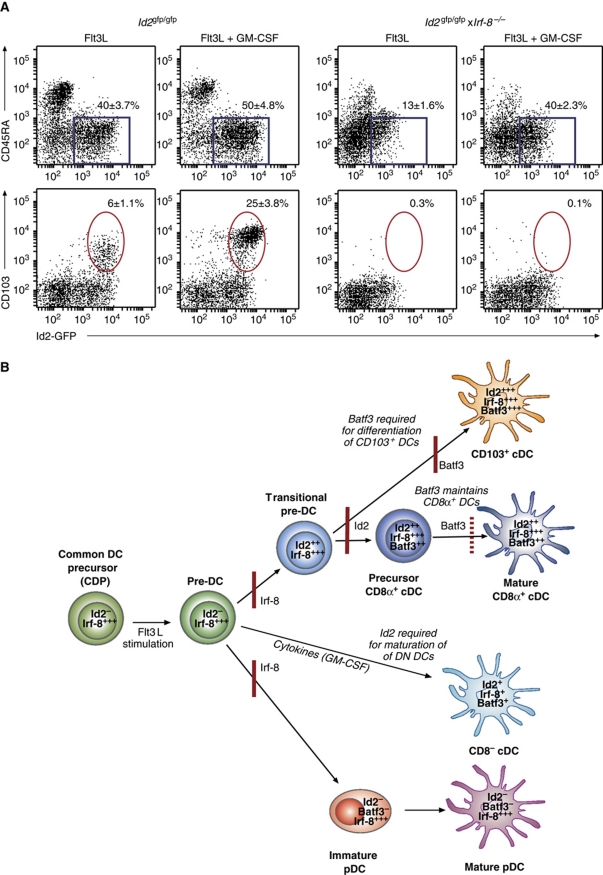
Dendritic cells (DCs) have critical roles in the induction of the adaptive immune response. The transcription factors Id2, Batf3 and Irf-8 are required for many aspects of murine DC differentiation including development of CD8α(+) and CD103(+) DCs. How they regulate DC subset specification is not completely understood. Using an Id2-GFP reporter system, we show that Id2 is broadly expressed in all cDC subsets with the highest expression in CD103(+) and CD8α(+) lineages. Notably, CD103(+) DCs were the only DC able to constitutively cross-present cell-associated antigens in vitro. Irf-8 deficiency affected loss of development of virtually all conventional DCs (cDCs) while Batf3 deficiency resulted in the development of Sirp-α(-) DCs that had impaired survival. Exposure to GM-CSF during differentiation induced expression of CD103 in Id2-GFP(+) DCs. It did not restore cross-presenting capacity to Batf3(-/-) or CD103(-)Sirp-α(-)DCs in vitro. Thus, Irf-8 and Batf3 regulate distinct stages in DC differentiation during the development of cDCs. Genetic mapping DC subset differentiation using Id2-GFP may have broad implications in understanding the interplay of DC subsets during protective and pathological immune responses.


Conflict of interest statement

The authors declare that they have no conflict of interest.

Figures

Figure 1
Figure 1
Generation and validation of Id2gfp reporter mouse strains. (A) The genomic locus of Id2. Exons are represented by boxes; introns are represented as black lines; coding regions are shaded yellow; non-translated regions are in white; arrows indicate the direction of translation. The alleles derived from the integration of the targeting vector and subsequent manipulations are shown. pA, polyadenylation signal sequence; circles, frt sites; triangles, loxP sites. The Id2-GFP reporter line was derived from an embryonic stem cell (ES) clone that lacked the 5′ LoxP site and was identified by PCR. The position and direction of the genotyping primers (a–c) and the SacI and XbaI sites used for Southern blotting are indicated. (B) Southern blot analysis of ES cell SacI-digested DNA showing the wild-type (12.6 kb) and targeted (8.9 kb) alleles (left panel). PCR genotyping of tail DNA using the primer set a/b/c showing the correct amplification of the wild-type (688 bp) and Id2gfp (959 bp) alleles (right panel). (C) Id2-GFP expression in B220+IgM+ B cells derived from peripheral LNs and splenic NK1.1+CD49b+ NK cells from naive wild-type (black line) and Id2gfp/gfp (green line) mice. (D) Quantitative PCR analysis for the indicated transcripts of live (PI) mixed populations of cells from spleen, thymus and bone marrow purified on the basis of their expression of Id2-GFP. Data are the mean±s.e.m. of two experiments.
Figure 2
Figure 2
Multiple DC subsets express Id2 in vivo. Id2gfp/gfp (green line) and wild-type (black line) cells were analysed by flow cytometry for GFP expression in different DC and myeloid populations. The different cell types were defined as described in Materials and methods. (A) Total DC (CD11c+) populations from thymus, spleen, peripheral LN and mesenteric LNs; (B) thymic DC populations; (C) splenic DC populations; (D) peripheral (pooled DCs from inguinal, brachial, axillary, superficial cervical LNs) and (E) mesenteric LN DCs; and (F) monocyte and macrophage (from peritoneal lavage) lineages. All plots are gated on CD11c+ cells and markers as indicated in the dot plots (left panels). In (D), the fluorescence intensity of Langerhans cells has been shown in red for comparison. Mean fluorescence intensity (MFI) is shown for GFP expression for each gated population. Data are representative of at least two to three independent experiments.
Figure 3
Figure 3
Expression of Id2 in lymphoid progenitors. (A) Bone marrow progenitor cells were analysed by depletion of lineage expressing cells then stained for sca-1, c-kit, M-CSFR and Flt3 and analysed by flow cytometry for linsca-1+c-kit+ (LSK) cells, lymphoid primed multipotent progenitors (LMPPs, defined as LSKFlt3high), common lymphoid progenitors (CLPs) and (B) common DC progenitor (CDPs) as indicated. (C) Bone marrow and splenic DC progenitors were analysed by depletion of lineage expressing cells (CD19, NK1.1, CD3 and Ter119) then stained for CD11c, Flt3, MHC II and Sirp-α and analysed for the pre-cDC population by flow cytometry (Liu and Nussenzweig, 2010). Profiles show the gating strategy in which CD11c+MHC II cells (region 1, R1) were then selected for expression of Flt3 and Sirp-α (region 2, R2). (D) CD11c+ cells were isolated from bone marrow by density gradient centrifugation. Gated populations from Id2gfp/gfp (green line) and wild-type (black line) mice were then assessed for GFP fluorescence. Data are representative of at least two experiments.
Figure 4
Figure 4
In vitro cross-presentation in Flt3L-stimulated cultures is limited to CD103-expressing Id2-GFPhigh DCs. (AC) Flt3L-derived DCs from Id2gfp/gfp BM were analysed on day 5 of culture. Six different DC populations were discriminated based on their expression of CD11c, CD45RA and CD103. Right panels: CD11c+CD45RA+Id2-GFP cells expressed markers of pDCs. Histograms show expression of Bst2 (upper right panel) and Siglec-H (lower right panel) of total CD45RAint cells (grey shading), CD45RAintId2-GFP immature pDCs (black line). The expression of markers for CD103CD45RAhigh (mature) pDC is indicated in red. (B) Populations 4, 5 and 6 could be discriminated based on their expression of Sirp-α or CD103. Profiles are representative of at least 10 independent experiments with similar results. (C) Id2-GFP DC subsets express distinct levels of Sirp-α and CD24. (D) In vitro generated Id2gfp/gfp DCs were flow cytometrically sorted 5 days after initiation of cell culture according to their expression of CD103, CD45RA, Sirp-α and Id2-GFP and analysed for their ability to cross-present cell-associated OVA to CFSE-labelled OVA-specific CD8+ T cells (upper panels). The ability of these subsets of present exogenous antigen to CFSE-labelled OVA-specific CD4+ T cells was evaluated as a control (lower panels). Data are representative of four independent experiments. T-cell proliferation was analysed in 1–3 replicates for each DC subset/responder population for each experiment. (E) Ly5.1+CFSE-labelled CD8+ OVA-specific T cells were adoptively transferred into H-2Kbm-1, B6 or Itgae−/− mice 1 day before transfer of 2 × 10⁷ OVA-coated H-2bm-1 splenocytes. Proliferation of Ly5.1+Vα2+CD8+ T cells in spleen was analysed by flow cytometry after 60 h. Data are representative of two independent experiments with seven individuals analysed in each group. (F) The expression level of surface CD103 was monitored by flow cytometry 18 h after exposure to TLR ligands LPS or CpG. Data are representative of at least five independent experiments and show MFI expression levels.
Figure 5
Figure 5
Quantitative RT–PCR analysis of the transcription factors Id2, Irf-8 and Batf3 in purified in vitro-derived and in vivo DC subsets. CD11c+ DCs purified from Flt3L-stimulated bone marrow on day 5 of culture, or isolated directly ex vivo from spleen or bone marrow were analysed. Data show the mean and s.d. relative to HPRT of two biological replicates each assayed in triplicate for each DC population. In vitro-derived DC populations correspond to populations 1–6 as outlined in Figure 4.
Figure 6
Figure 6
Id2, Irf-8 and Batf3 regulate distinct DC subsets in vitro. (A) Flt3L-derived DCs from Id2gfp/gfp, Id2gfp/gfpIrf-8−/− and Id2gfp/gfpBatf3−/− mice were analysed for the development of different DC subsets. Cells were stained for their expression of CD11c, CD45RA and CD103 at days 5 and 8 after initiation of cultures. Data show CD11c+ cells and are representative of at least three independent experiments. (B) Total number of CD11c+ and Id2-GFP+CD45RAintCD103 DCs generated per 1.5 × 10⁶ bone marrow input cells from Id2gfp/gfp and Id2gfp/gfpBatf3−/− bone marrow at days 5 and 8 in the presence of 100 ng/ml Flt3L. Data show mean±s.e.m. of six individual cultures for each strain at each time point. (C) Histograms (top panels) showing representative profiles of BrdU incorporation in in vitro generated Id2-GFP+CD45RAintCD103 DCs from Id2gfp/gfp and Id2gfp/gfpBatf3−/− bone marrow on day 5 of culture. Bar graphs show BrdU incorporation for each DC subset. Data show the mean±s.e.m. of cultures from bone marrow of 6–9 individual mice for each strain at days 5 and 8. (D, E) Analysis of Annexin V expression on DCs generated as in (C). Cells were stained for surface markers as indicated before staining for Annexin V expression and analysis by flow cytometry. (D) Graph shows expression on days 5 and 8 showing the mean±s.e.m. of cultures from bone marrow of six individual mice pooled from two independent experiments for each strain at days 5 and 8. (E) Histograms show representative profiles of Annexin V staining on day 8 in total CD11c+ DCs, Id2-GFP+CD45RAint and Id2-GFP+CD45RA DC subsets derived from Id2gfp or Id2gfp/gfpBatf3−/− bone marrow. Statistical differences were determined using a one-tailed Student’s t-test.
Figure 7
Figure 7
GM-CSF enhances expression of CD103 but does not restore cross-presenting function in the absence of Batf3. (A) Bone marrow from Id2gfp/gfp and Id2gfp/gfp × Batf3−/− mice was cultured with Flt3L for 5 days. In some cases, GM-CSF was added 2 days before analysis of cultures for the development of different DC subsets. Profiles are gated on CD11c+CD19NK1.1CD3 cells. (B) DCs of the indicated genotypes were generated in vitro in response to Flt3L or Flt3L and GM-CSF as described in (A). DCs were flow cytometrically sorted 5 days after initiation of cell culture according to their expression of CD103, CD45RA, Sirp-α and Id2-GFP and analysed for their ability to cross-present cell-associated OVA to CFSE-labelled OVA-specific CD8+ T cells (left panels). The ability of these subsets of present exogenous antigen to CFSE-labelled OVA-specific CD4+ T cells was evaluated as a control (right panels). Data are representative of at least three independent experiments with similar results and show the mean±s.d. (n=6–10 per genotype).
Figure 8
Figure 8
(A) GM-CSF does not induce CD103+ or Sirp-α DCs but enhances Id2-GFP+Sirp-α+ DC development in the absence of Irf-8. (A) Bone marrow from Id2gfp/gfp and Id2gfp/gfp × Irf-8−/− mice was cultured with Flt3L for 8 days. In some cases, GM-CSF was added 2 days before analysis of cultures for their expression of CD103, CD45RA and Id2-GFP. Dot profiles are gated on CD11c+NK1.1CD19CD3εPI cells. (B) The expression of Sirp-α on Id2-GFP+ cells (indicated by the blue box, panel (A)) is shown. The percent of Sirp-α+ and Sirp-α cells for CD11c+Id2-GFP+ cells is shown on each plot. Data are representative of at least three independent experiments with similar results and show the mean±s.d. (n=6–8 per genotype). (B) Model of differentiation of DCs and the requirement for Id2, Irf-8 and Batf3 in this process. Common DC and pre-DCs do not express Id2 and can be activated by Flt3L stimulation. Irf-8 is required for the generation of pDCs, CD8α+ and CD103+ DCs, but not DN DCs which can be induced to differentiate in the absence of both Id2 or Irf-8 when exposed to cytokines such as GM-CSF. Id2 is induced in differentiating cDCs and is required for the generation of CD8α+ and CD103+ DCs, but not pDCs, found in spleen and peripheral LNs. Batf3 is essential for the generation of CD103+ DCs but is dispensable for the development of precursor CD8α+ DCs which depend on Batf3 for their maintenance and full differentiation into mature cells in spleen and peripheral tissues. Precursor cells—CDP and Pre-DCs—are defined as linckitintFlt3+M-CSF+ and linCD11cintFlt3+Sirp-α+MHC II, respectively, as previously defined (Naik et al, 2006; Liu et al, 2009). These precursor populations do not express Id2 suggesting that a transitional cDC stage (transitional pre-DC) occurs in which Id2 expression is switched on but DCs have not yet adopted their mature phenotypes. Mature DCs have been defined as described in Supplementary Table SI. Data describing the role of Id2 are derived from unpublished experiments in which Id2 has been specifically ablated in CD11c-expressing cells using Cre-mediated deletion (JTJ and GTB.; Ginhoux et al, 2009). The presence of precursor CD8α+, but not mature, CD8α+ DCs are evident by their expression of the CD11c+Id2-GFP+CD45RAintSirp-α phenotype in the absence of Batf3. The red lines represent where loss of a transcription factor blocks further DC development.

References

    1. Aliberti J, Schulz O, Pennington DJ, Tsujimura H, Reis e Sousa C, Ozato K, Sher A (2003) Essential role for ICSBP in the in vivo development of murine CD8alpha + dendritic cells. Blood 101: 305–310 - PubMed
    1. Allan RS, Smith CM, Belz GT, van Lint AL, Wakim LM, Heath WR, Carbone FR (2003) Epidermal viral immunity induced by CD8alpha+ dendritic cells but not by Langerhans cells. Science 301: 1925–1928 - PubMed
    1. Allenspach EJ, Lemos MP, Porrett PM, Turka LA, Laufer TM (2008) Migratory and lymphoid-resident dendritic cells cooperate to efficiently prime naive CD4 T cells. Immunity 29: 795–806 - PMC - PubMed
    1. Bachem A, Guttler S, Hartung E, Ebstein F, Schaefer M, Tannert A, Salama A, Movassaghi K, Opitz C, Mages HW, Henn V, Kloetzel PM, Gurka S, Kroczek RA (2010) Superior antigen cross-presentation and XCR1 expression define human CD11c+CD141+ cells as homologues of mouse CD8+ dendritic cells. J Exp Med 207: 1273–1281 - PMC - PubMed
    1. Barnden MJ, Allison J, Heath WR, Carbone FR (1998) Defective TCR expression in transgenic mice constructed using cDNA-based alpha- and beta-chain genes under the control of heterologous regulatory elements. Immunol Cell Biol 76: 34–40 - PubMed

Publication types

MeSH terms