. 2011:2:314.
doi: 10.1038/ncomms1311.

Transcription factor IRF8 directs a silencing programme for TH17 cell differentiation

Affiliations
Free PMC article

Transcription factor IRF8 directs a silencing programme for TH17 cell differentiation

Xinshou Ouyang et al. Nat Commun. 2011.
Free PMC article

Abstract

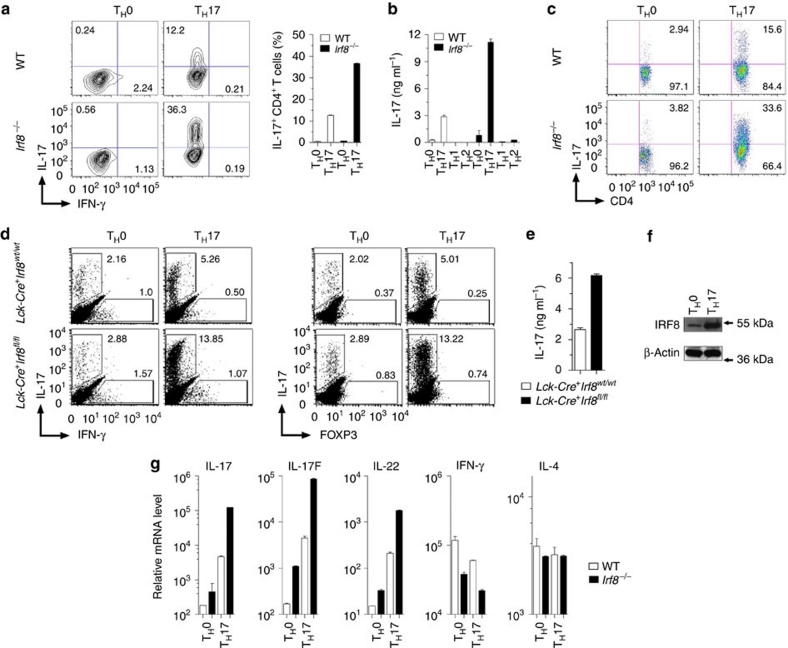
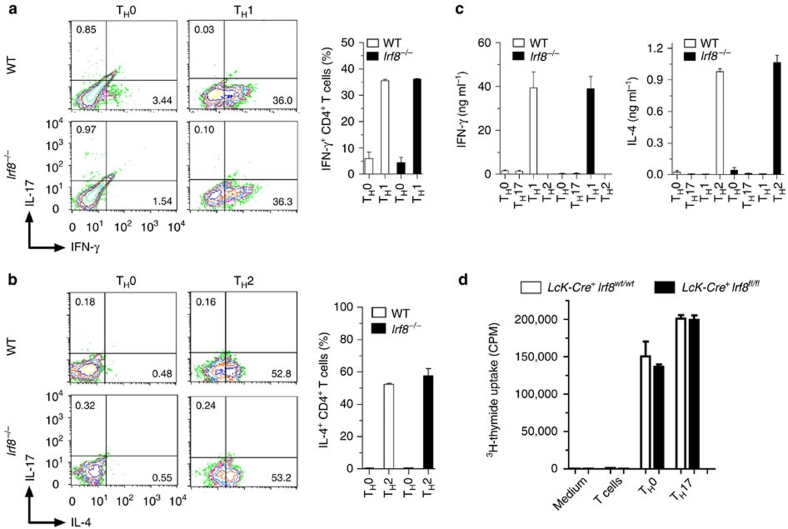
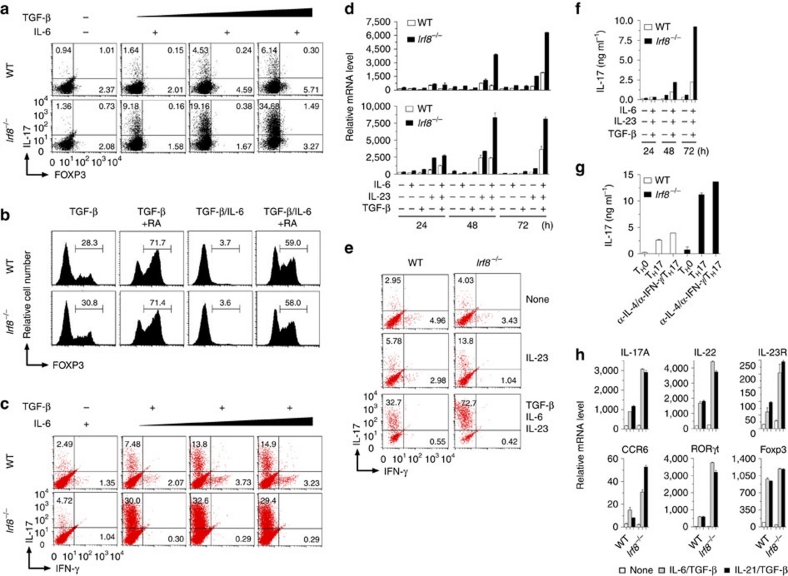
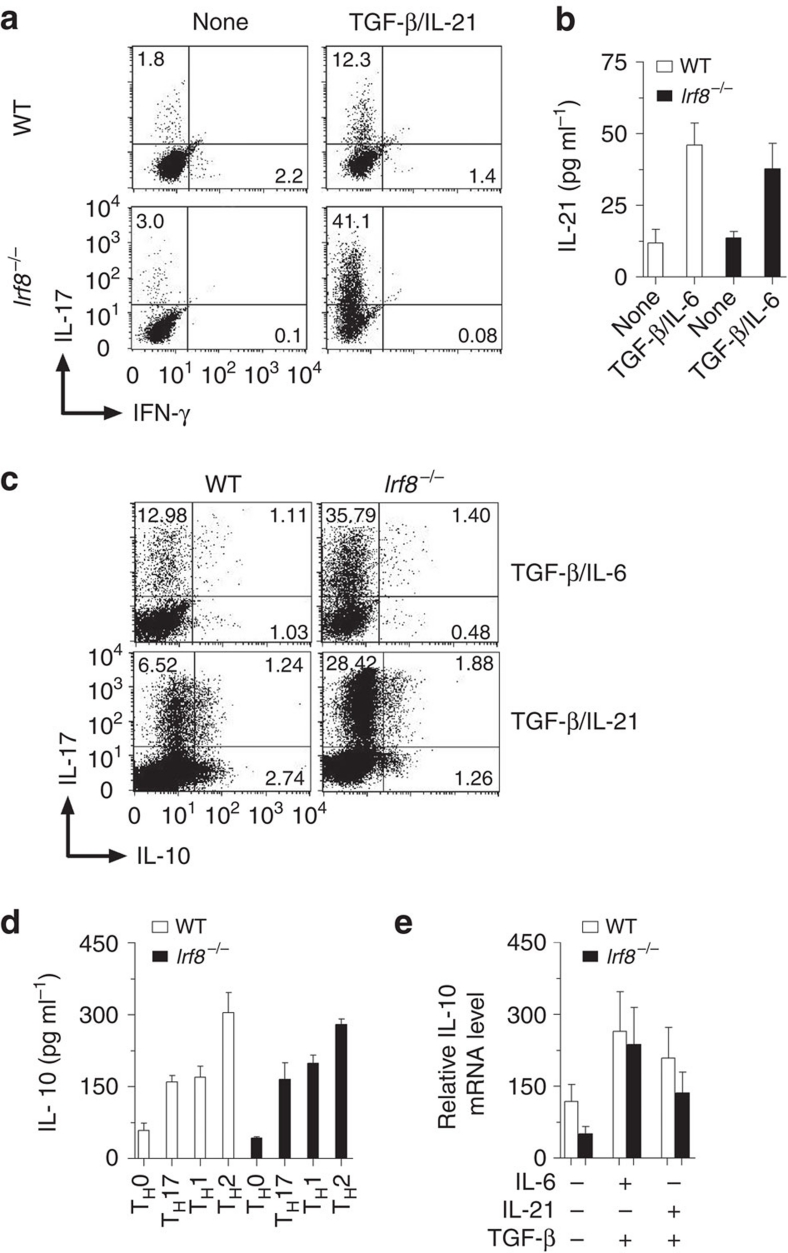
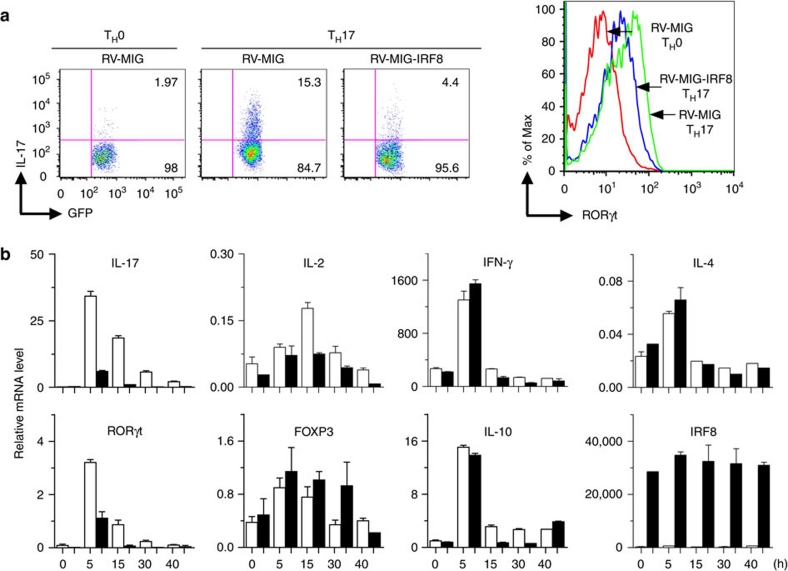
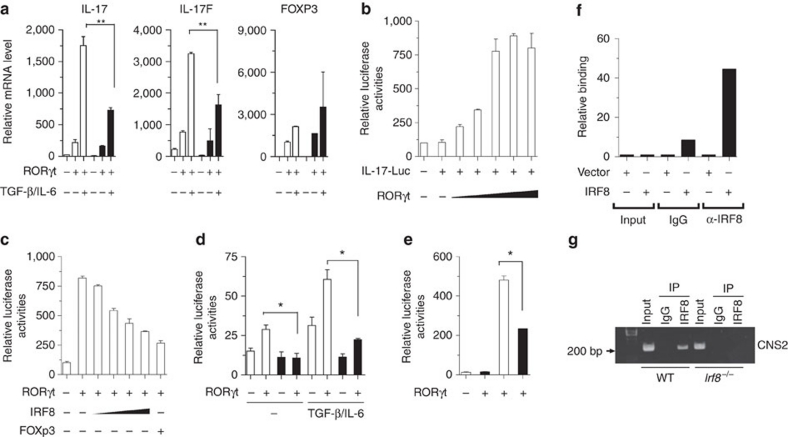
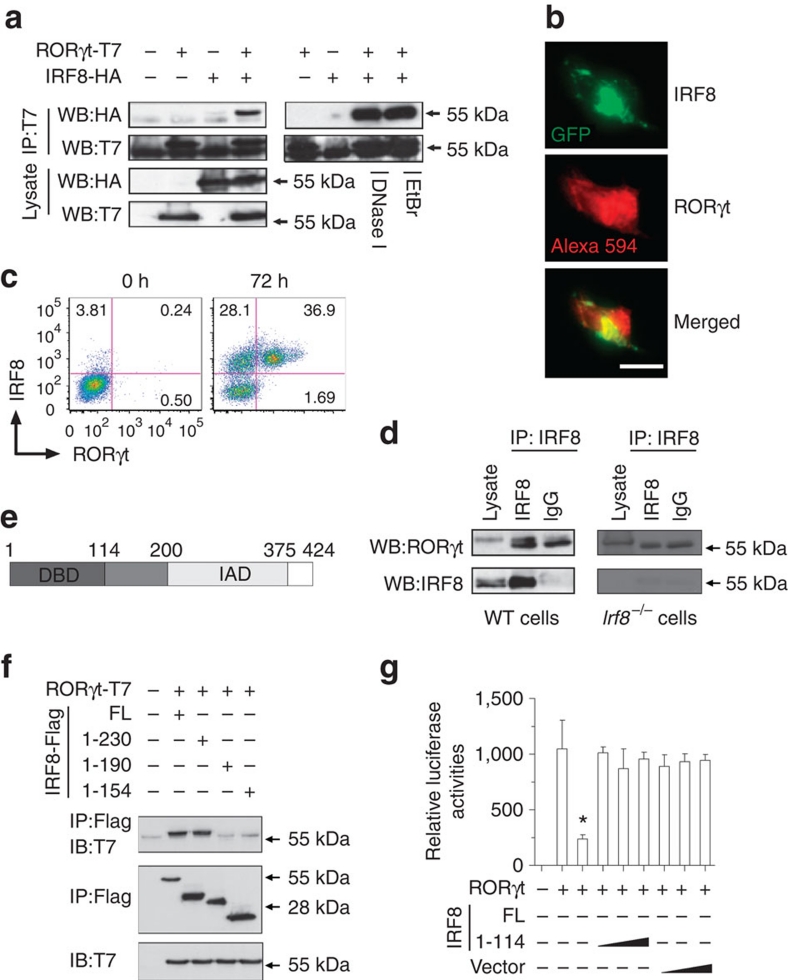
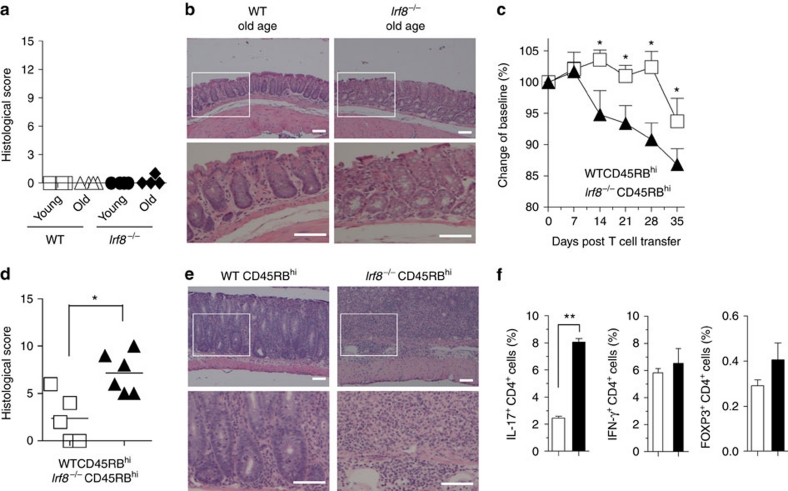
T(H)17 cells are recognized as a unique subset of T helper cells that have critical roles in the pathogenesis of autoimmunity and tissue inflammation. Although RORγt is necessary for the generation of T(H)17 cells, the molecular mechanisms underlying the functional diversity of T(H)17 cells are not fully understood. Here we show that a member of interferon regulatory factor (IRF) family of transcription factors, IRF8, has a critical role in silencing T(H)17-cell differentiation. Mice with a conventional knockout, as well as a T cell-specific deletion, of the Irf8 gene exhibited more efficient T(H)17 cells. Indeed, studies of an experimental model of colitis showed that IRF8 deficiency resulted in more severe inflammation with an enhanced T(H)17 phenotype. IRF8 was induced steadily and inhibited T(H)17-cell differentiation during T(H)17 lineage commitment at least in part through its physical interaction with RORγt. These findings define IRF8 as a novel intrinsic transcriptional inhibitor of T(H)17-cell differentiation.


Figures

Figure 1
Figure 1. Increased IL-17 production in IRF8 deficient T helper cells.
(a) Naive CD4+ T cells from wild-type (WT) or Irf8–/– mice were differentiated under TH0 and TH17 polarizing conditions for 4 days. Cells were then re-stimulated with PMA/ionomycin for 5 h, stained for intracellular IL-17 and IFN-γ, and analysed by flow cytometry. Representative fluorescence-activated cell sorting (FACS) dot plots gated on CD4+ cells and the percentages of IL-17-producing CD4+ cells are shown. Data are from one experiment representative of three independent experiments. Error bars, s.d. (b) The cells prepared in a, TH1 and TH2 polarizing conditions were re-stimulated with PMA/ionomycin for 24 h and the supernatants were analysed for IL-17 by ELISA. Data are from one experiment representative of three independent experiments. Error bars, s.d. (c) Wild-type or Irf8–/– lamina propria lymphocytes (LPL) were differentiated under TH17 conditions for 4 days. Cells were then re-stimulated with PMA/ionomycin for 5 h, stained for intracellular IL-17 and analysed by flow cytometry. (d) Naive CD4+ T cells from Lck-Cre+Irf8wt/wt and Lck-Cre+Irf8fl/fl mice were differentiated under TH0 and TH17 polarizing conditions for 4 days and the cells were re-stimulated with PMA/ionomycin for 5 h for staining of IL-17, IFN-γ and FOXP3. Representative FACS dot plots gated on CD4+ cells are shown. (e) The cells prepared in d were re-stimulated with PMA/ionomycin for 24 h and the supernatants were analysed for IL-17 by ELISA. Data are from one experiment representative of two independent experiments. Error bars, s.d. (f) Naive CD4+ T cells from C57BL/6 mice were differentiated under TH0 and TH17 conditions for 4 days. The cells were re-stimulated with PMA/ionomycin for 12 h and IRF8 expression was analysed by western blot. (g) The cells prepared in a were re-stimulated with PMA/ionomycin for 5 h and mRNA expression of indicated genes was determined by qPCR. The data shown were normalized to levels of ubiquitin expression as analysed by qPCR. The results are representative of three independent experiments. Error bars, s.d.
Figure 2
Figure 2. TH1 and TH2 differentiation in Irf8–/– CD4+ T cells.
Naive CD4+ T cells of WT or Irf8–/– mice were differentiated under TH1 or TH2 polarizing conditions for 4 days. Cells were then re-stimulated with PMA/ionomycin for 5 h and stained for intracellular IFN-γ as a TH1 marker (a) and IL-4 as a TH2 marker (b) by flow cytometry. Data are from one experiment representative of three independent experiments. Error bars, s.d. The cells prepared in a and b were re-stimulated with PMA/ionomycin for 12 h and the supernatants were analysed for IFN-γ and IL-4 by ELISA (c). Data are from one experiment representative of three independent experiments. Error bars, s.d. Naive CD4+ T cells from spleens and lymph nodes of Lck-Cre+Irf8wt/wt and Lck-Cre+Irf8fl/fl mice were prepared and the cells were differentiated under TH0 and TH17 polarizing conditions for 3 days. [3H]-Thymidine was added during the last 8 h of culture. Then the cells were collected and were counted with a beta-counter (d). Data are from one experiment representative of two independent experiments. Error bars, s.d.
Figure 3
Figure 3. IRF8 inhibits the expression of TH17-associated genes.
Naive CD4+ T cells from wild-type and Irf8–/– mice were stimulated with plate-bound anti-CD3 and anti-CD28 antibodies in the presence of IL-6 (10 ng ml−1) plus differing concentrations of TGF-β (0.1, 1, 5 ng ml−1) (a), or TGF-β (5 ng ml−1), TGF-β (5 ng ml−1)/IL-6 (10 ng ml−1) with or without retinoic acid (RA, 100 nM) (b). After 4 days of stimulation, IL-17 and FOXP3 intracellular staining was performed and analysed by flow cytometry. (c) The cells prepared in a and b except for the presence of TGF-β (5 ng ml−1) plus various concentrations of IL-6 (5, 10, 50, 100 ng ml−1) were re-stimulated with PMA/ionomycin for 5 h and stained for intracellular IL-17 and IFN-γ and analysed by flow cytometry. (d) Naive CD4+ T cells from wild-type and Irf8–/– mice were stimulated with IL-6, IL-23, TGF-β or different combinations of these cytokines for various intervals. Total RNA was extracted and analysed by RT–PCR for mRNA expression of IL-17 (top panel) and IL-17F (bottom panel). Data are from one experiment representative of three independent experiments. Error bars, s.d. (e) Naive CD4+ T cells from WT and Irf8–/– mice were stimulated with the indicated cytokines for 4 days. Cells were re-stimulated with PMA/ionomycin for 5 h and stained for intracellular IL-17 and IFN-γ and analysed by flow cytometry. The results are representative of three independent experiments. (f) Cells were prepared as in e and the culture supernatants were collected after 4 days of stimulation. IL-17 protein secretion was analysed by ELISA. (g) Naive CD4+ T cells from WT and Irf8–/– mice were prepared and stimulated with TGF-β and IL-6 in the presence of neutralizing anti-IFN-γ (10 μg ml−1) and anti-IL-4 (10 μg ml−1) antibodies. At 72 h after the stimulation, IL-17 protein secretion in culture supernatants was analysed by ELISA. Data are the mean±s.d. of triplicate cultures. (h) Naive CD4+ T cells from wild-type or Irf8–/– mice were stimulated with the indicated cytokine combinations for 48 h. Total RNA was extracted and analysed by qPCR for mRNA expression of the indicated genes. Data are from one experiment representative of three independent experiments. Error bars, s.d.
Figure 4
Figure 4. IL-21 signalling and IL-10 production during TH17-cell differentiation in Irf8–/– mice.
Naive CD4+ T cells from WT and Irf8–/– mice were prepared, and the cells were stimulated with anti-CD3 and anti-CD28 antibodies in the presence or absence of TGF-β plus IL-21 or IL-6 for 72 h. Intracellular staining for IL-17 and IFN-γ expression was performed and analysed by flow cytometry (a). The secretion of IL-21 protein in culture supernatants was analysed by ELISA (b). Data are from one experiment representative of three independent experiments. Error bars, s.d. Naive CD4+ T cells were stimulated with anti-CD3 and anti-CD28 antibodies in the presence of TGF-β plus IL-6 or IL-21. At 96 h after stimulation, intracellular staining for IL-17 and IL-10 was performed and analysed after re-stimulation with PMA/ionomycin by flow cytometry (c). Naive CD4+ T cells from spleens and lymph nodes of WT and Irf8–/– mice were prepared and the cells were stimulated under TH0, TH1, TH2 and TH17 polarizing conditions for 4 days. Then the cells were re-stimulated with PMA/ionomycin for 12 h and IL-10 protein secretion was analysed by ELISA (d). Data are from one experiment representative of three independent experiments. Error bars, s.d. Naive CD4+ T cells were stimulated with anti-CD3 and anti-CD28 antibodies in the presence of TGF-β plus IL-6 or IL-21 for 72 h. IL-10 expression was analysed by RT–PCR (e). Data are from one experiment representative of three independent experiments. Error bars, s.d.
Figure 5
Figure 5. Transduction of IRF8 inhibits TH17-associated genes.
(a) Naive CD4+ T cells from C57BL/6 mice were infected with retrovirus encoding IRF8 or empty vector and were activated under TH17-inducing conditions for 4 days. The cells were re-stimulated with PMA/ionomycin for 5 h and stained for intracellular IL-17 and RORγt and analysed by flow cytometry. (b) EL4 cells were transduced with retroviruses encoding IRF8 (black column) or GFP (white column) for 48 h and the transduced cells were then stimulated with PMA/ionomycin for various times as indicated. Total RNA was extracted and the transcript levels of TH17-associated genes were analysed by qPCR as indicated. The results are normalized to ubiquitin levels. Data are from one experiment representative of three independent experiments. Error bars, s.d.
Figure 6
Figure 6. IRF-8 represses IL-17 transcription.
(a) IRF8-expressing EL4 cells (black column) or control cells (white column) were transiently transfected with a RORγt plasmid for 24 h, and the cells were treated with plate-bound anti-CD3 and anti-CD28 antibodies in the presence or absence of the indicated cytokines for 8 h. qPCR analyses of transcripts of the indicated genes were performed and the results were normalized to the levels of ubiquitin transcripts. **P<0.01 versus cells transfected with IRF8 (Student's t-test). Data are representative of multiple experiments. (b) 293T cells were co-transfected with an IL-17 promoter reporter construct containing a 6-kbp promoter and increasing doses of a RORγt plasmid for 30 h. (c) 293T cells were co-transfected with an IL-17 promoter reporter construct containing a 6-kbp promoter, a RORγt plasmid, a FOXP3 plasmid, and increasing doses of an IRF8 plasmid for 30 h. (d) IRF8-expressing EL4 cells (black column) or control cells (white column) were co-transfected with an IL-17 promoter reporter construct containing a 6-kbp promoter plus RORγt plasmid, and treated with plate-bound anti-CD3 antibody in the presence or absence of the indicated cytokines for 24 h. Luciferase activities in (b, c, d) were measured and normalized to β-galactosidase activity. Data are mean±s.d. of triplicate cultures and are representative of three independent experiments. *P<0.05 versus cells transfected with IRF8 (Student's t-test). (e) IRF8-expressing EL4 cells (black column) or control cells (white column) were co-transfected with an IL-17 promoter reporter construct containing a minimal 1.1-kb promoter plus CNS2, and RORγt plasmids. The cells were treated with plate-bound anti-CD3 and anti-CD28 antibodies and IL-6/TGF-β for 24 h. A luciferase assay was performed as described in (b), (c), and (d). *P<0.05 versus cells transfected with IRF8 (Student's t-test). (f) 293T cells were co-transfected with an IL-17 promoter reporter construct (containing CNS2) with either an IRF8 overexpression plasmid or a control vector for 36 h, followed by ChIP analysis. 3 μg of anti-IRF8 antibody or isotype-matched IgG as control antibody were used in the immunoprecipitation step. qPCR was used to quantify the amount of precipitated DNA with primers flanking the CNS2 region of the IL-17 promoter. Data were normalized to input DNA in each respective sample. (g) Naive CD4+ T cells from wild-type or Irf8–/– mice were cultured under TH17-polarizing conditions for 60 h, followed by ChIP assay as described above. 3 μg of anti-IRF8 antibody or isotype-matched IgG as control antibody were used in the immunoprecipitation step. PCR was used to quantify the amount of precipitated DNA with primers flanking the CNS2 region of the IL-17 promoter.
Figure 7
Figure 7. IRF8 interacts physically with RORγ.
(a) 293T cells were transfected with HA-tagged IRF8 and T7-tagged RORγt overexpression plasmids for 40 h and cell lysates were prepared in the presence or absence of DNase I or ethidium bromide. 500 μg of cell lysates were immunoprecipitated with an anti-T7 antibody and immunoblotted with specific antibodies as indicated. Data are representative of three independent experiments. (b) NIH3T3 cells were transiently transfected with GFP-IRF8 and T7-RORγt for 40 h, and cells were fixed and stained red for RORγt followed by confocal microscopic analysis. Scale bar, 50 μm. (c) Naive CD4+ T cells from WT mice were cultured under TH17-polarizing conditions for 72 h and the expression of RORγt and IRF8 was analysed by flow cytometry. The cells were gated on CD4+ T cells. Data are representative of three independent experiments. (d) Naive CD4+ T cells from wild-type or Irf8–/– mice were cultured under TH17-polarizing conditions for 60 h and the cell lysates were then immunoprecipitated with an anti-IRF8 antibody and western blotted (WB) with anti-RORγt and anti-IRF8 antibodies. Data represent three independent experiments. (e) Diagrams of IRF8 protein domains. (f) 293T cells were co-transfected with plasmids containing Flag-tagged full-length IRF8, IRF8 fragments (1–230, 1–190, 1–154) and T7-tagged RORγt plasmid for 40 h, and co-immunoprecipitation using anti-Flag antibody from the cell extracts was performed and immunoblotted with anti-T7 antibody. Data are representative of three independent experiments. (g) 293T cells were co-transfected with an IL-17 promoter reporter construct containing the 6-kbp promoter, a RORγt plasmid and either a full-length IRF8 or the IRF8 truncation mutant (1–114) construct for 30 h. Luciferase assays were performed as described in b. Data indicate mean±s.d. of triplicate cultures and are representative of three independent experiments. *P<0.05 versus cells transfected with IRF8 mutant (Student's t-test).
Figure 8
Figure 8. Lack of IRF8 enhances the TH17 immune response in experimental colitis.
WT and Irf8–/– mice were maintained under specific pathogen free (SPF). conditions for up to 18 months. Mice were killed and intestines were removed for histological analysis. Histology of colon tissues (a) and disease score (b) from age-matched young (15 weeks) and old (17–18 months) WT and Irf8–/– mice (three to four mice in each group). Scale bars, 200 μm. CD4+CD45RBhi T cells were purified from spleens and lymph nodes of wild-type or Irf8–/– mice and 5×10⁵ cells were injected (i.p.) into recipient Rag–/– mice. Body weight change was monitored every week and mice were killed 7 weeks later. (c) Changes in body weight of Rag1–/– mice (n=5–6 mice per group) after intraperitoneal transfer of WT or Irf8–/– CD4+CD45RBhi T cells were recorded. Data are presented as the mean±s.d. of the percentage of initial body weight and are representative of two similar experiments. *P<0.05 versus recipients of WT cells (ANOVA test and Student's t-test). Disease scores (d) and sections of colons with colitis (e) from Rag1–/– mice (n=5–6 mice in each group) on day 35 after naive T cell transfer as described in c. *P<0.05 versus recipients of WT cells (Mann–Whitney test). Scale bars, 200 μm. (f) The percentage of IL-17, IFN-γ and FOXP3-producing cells from mesenteric lymph nodes of Rag1–/– mice in c (white column, transfer with WT cells; black column, transfer with Irf8–/– cells). **P<0.01 versus wild-type cell transferred mice (Student's t-test). Data are presented as the mean±s.d. from four mice in each group. Two independent experiments were performed with similar results.

References

    1. Bettelli E., Korn T. & Kuchroo V. K. Th17: the third member of the effector T cell trilogy. Curr. Opin. Immunol. 19, 652–657 (2007). - PMC - PubMed
    1. Weaver C. T., Harrington L. E., Mangan P. R., Gavrieli M. & Murphy K. M. Th17: an effector CD4 T cell lineage with regulatory T cell ties. Immunity 24, 677–688 (2006). - PubMed
    1. Zheng Y. et al. Interleukin-22, a T(H)17 cytokine, mediates IL-23-induced dermal inflammation and acanthosis. Nature 445, 648–651 (2007). - PubMed
    1. Liang S. C. et al. Interleukin (IL)-22 and IL-17 are coexpressed by Th17 cells and cooperatively enhance expression of antimicrobial peptides. J. Exp. Med. 203, 2271–2279 (2006). - PMC - PubMed
    1. Veldhoen M., Hocking R. J., Atkins C. J., Locksley R. M. & Stockinger B. TGFbeta in the context of an inflammatory cytokine milieu supports de novo differentiation of IL-17-producing T cells. Immunity 24, 179–189 (2006). - PubMed

Publication types

Substances

LinkOut - more resources