. 2011:2:319.
doi: 10.1038/ncomms1324.

Predicting sites of ADAR editing in double-stranded RNA

Affiliations
Free PMC article

Predicting sites of ADAR editing in double-stranded RNA

Julie M Eggington et al. Nat Commun. 2011.
Free PMC article

Abstract

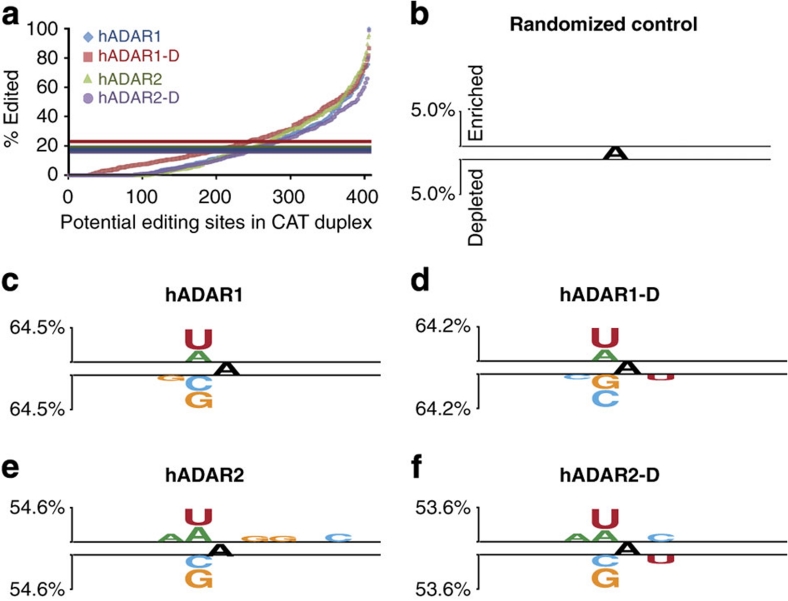
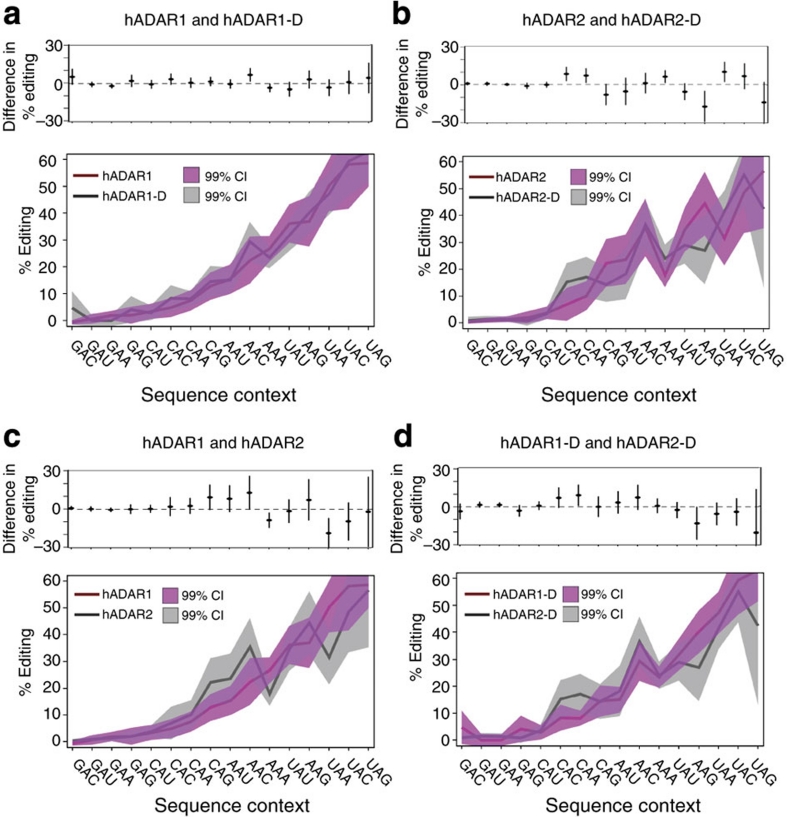
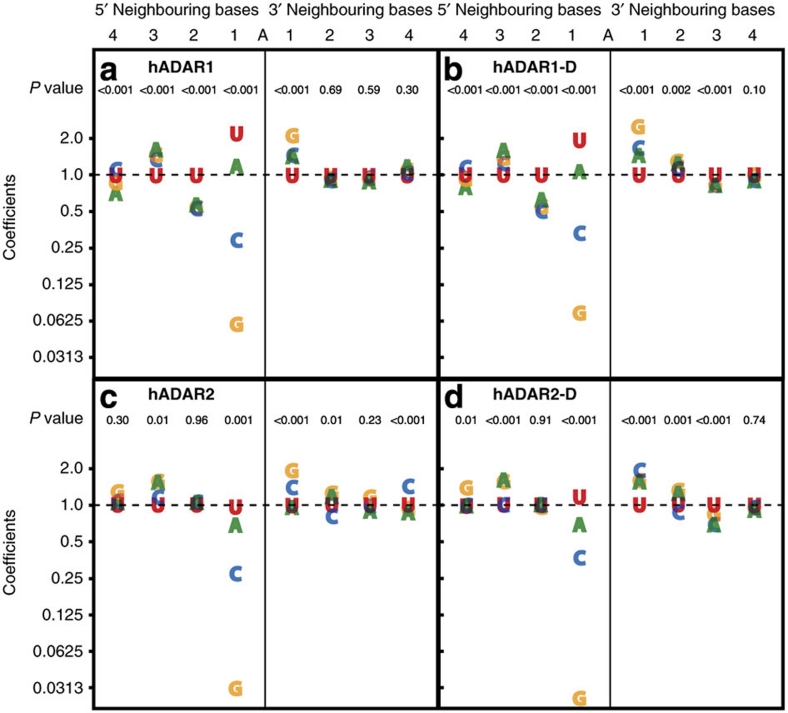
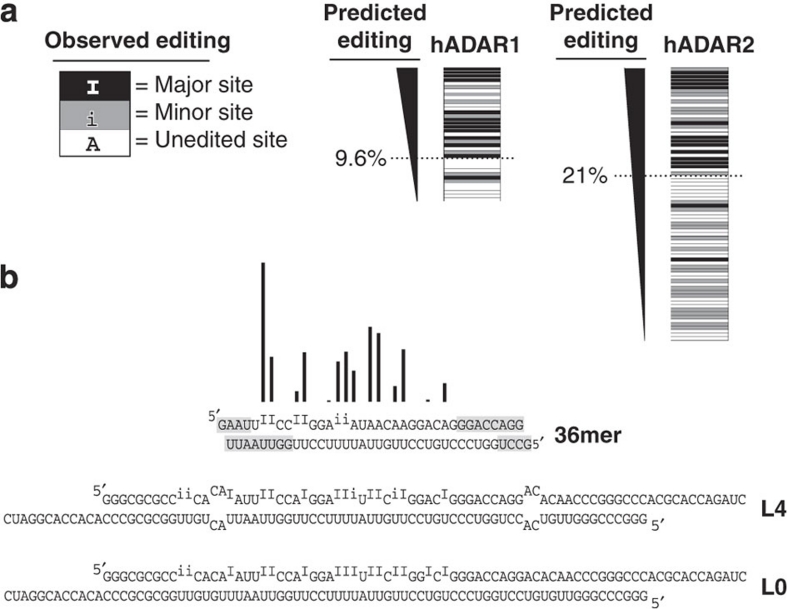
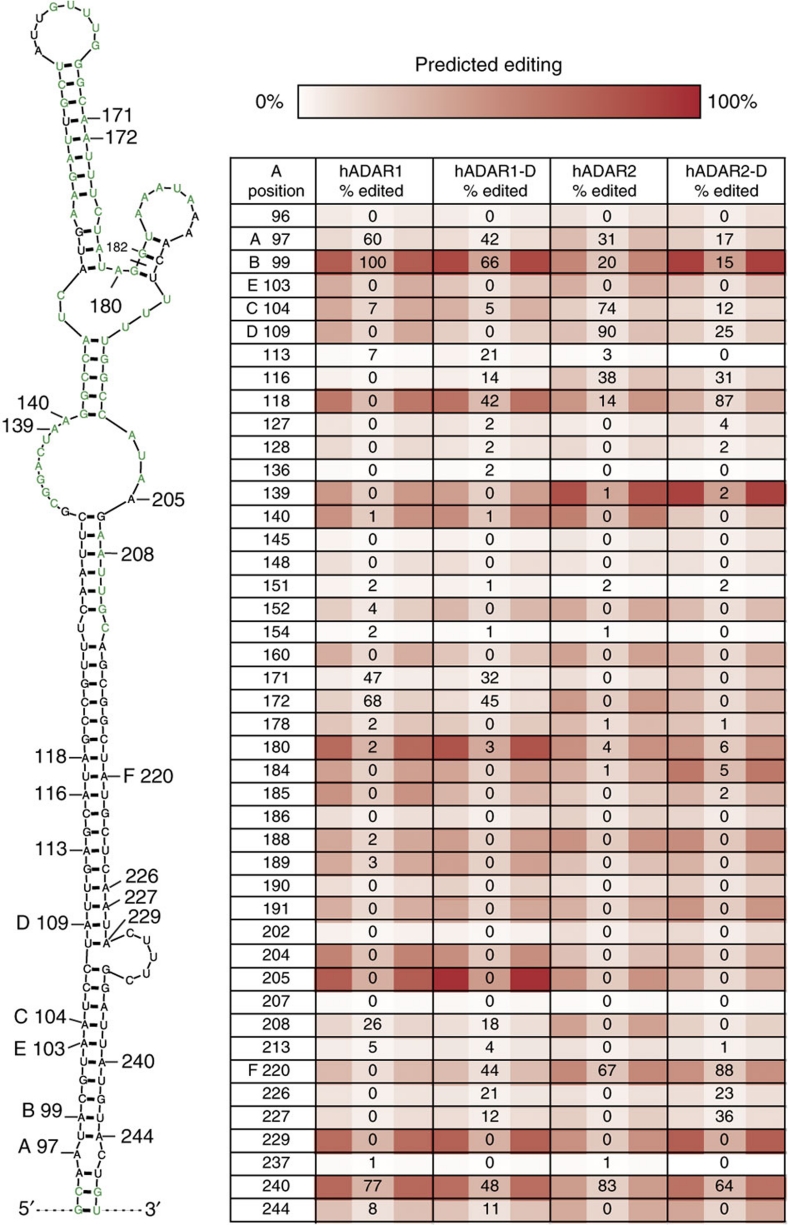
ADAR (adenosine deaminase that acts on RNA) editing enzymes target coding and noncoding double-stranded RNA (dsRNA) and are essential for neuronal function. Early studies showed that ADARs preferentially target adenosines with certain 5' and 3' neighbours. Here we use current Sanger sequencing protocols to perform a more accurate and quantitative analysis. We quantified editing sites in an ∼800-bp dsRNA after reaction with human ADAR1 or ADAR2, or their catalytic domains alone. These large data sets revealed that neighbour preferences are mostly dictated by the catalytic domain, but ADAR2's dsRNA-binding motifs contribute to 3' neighbour preferences. For all proteins, the 5' nearest neighbour was most influential, but adjacent bases also affected editing site choice. We developed algorithms to predict editing sites in dsRNA of any sequence, and provide a web-based application. The predictive power of the algorithm on fully base-paired dsRNA, compared with biological substrates containing mismatches, bulges and loops, elucidates structural contributions to editing specificity.


Figures

Figure 1
Figure 1. Binary analysis using Two Sample Logo software.
(a) Bulk sequencing of the 795-bp dsRNA RT–PCR product allowed measurement of 406 adenosines on the sense and antisense strands combined. The plot arranges each site in order of increasing percentage of editing measured within the population of RT–PCR products. Coloured horizontal lines show mean overall A-to-I conversion of the 795-bp dsRNA incubated with each ADAR: hADAR1 (blue)=17.8%, hADAR1-D (red)=22.7%, hADAR2 (green)=19.1% and hADAR2-D (purple)=16.4%. For Two Sample Logo analyses (bf), sequence contexts edited to a greater extent than the mean were scored as enriched, and those edited less than the mean as depleted. Neighbour preferences of the different ADARs were determined from a single incubation, but repeated experiments showed the same relative pattern of editing among the 406 adenosines, even when protein concentrations differed between experiments. (bf) Logo displays enriched bases above top line and depleted bases below bottom line for neighbouring five bases on both sides of the central edited adenosine. Level of enrichment/depletion is shown by letter heights with reference to scale on the left; y-axes as in (b). Two Sample Logo settings: t-test, show base if P value <0.005 and no Bonferroni correction. Panels show: (b) Two Sample Logo of Randomized Control; (c) hADAR1; (d) hADAR1-D; (e) hADAR2; and (f) hADAR2-D.
Figure 2
Figure 2. Quantitative comparison of editing for different triplets.
Bottom plots of ad show the 16 possible triplet contexts on the x axis with edited A in the centre, ordered according to hADAR1 preferences. 406 adenosines were used to determine the average percentage of the population edited in each triplet context, which is plotted on the y axis and normalized as described (see Methods). The 99% confidence interval (CI) for sample averages is indicated by shading. Top plots show differences in average percentage editing between compared proteins, with values for each triplet shown as black ovals and 99% confidence intervals as vertical lines. Panels show comparisons of triplet preferences for (a) hADAR1 compared with hADAR1-D, (b) hADAR2 compared with hADAR2-D, (c) hADAR1 compared with hADAR2 and (d) hADAR1-D compared with hADAR1-D. See Methods for a description of statistical methodology.
Figure 3
Figure 3. Analysis of the coefficients for the eight-term model.
The vertical axis of each panel (ad for the different ADARs) plots the coefficients used in the eight-term multiplicative regression model (numerical values in Supplementary Data 1). To obtain an estimate of the % editing of a target adenosine, coefficients for each of the eight-base positions are multiplied together, and this value is multiplied by 20 to account for the normalization of the mean % editing to 20% (see Methods). The P values given for 5′ and 3′ positions (top of each panel) evaluate the null hypothesis that the % editing of the target adenosine is unrelated to the identity of the base at that position; a small P value indicates that at least two of the four possible bases at the indicated position lead to different amounts of editing of the target adenosine. Widely dispersed plot symbols (and low P values) at a particular position indicate a large effect of the identity of the base at that position on the % editing of the target adenosine, whereas overlapping plot symbols (and high P values) indicate little or no effect of the identity of the base at that position.
Figure 4
Figure 4. The hADAR1 and hADAR2 eight-term nearest neighbour regression models as predictive tools.
(a) The major (black), minor (grey) and below-detection/no editing (white) sites of dsRNAs previously reported are ranked according to percentage of editing predicted by the eight-term best-fit model. In the previously published analysis, the boundary for scoring a site as edited/unedited was dictated by the sensitivity of methods available at the time. We used a best-fit analysis to define this cutoff as 9.6% for hADAR1, and 21% for hADAR2. Locations of editing sites within these dsRNAs are shown in Supplementary Figure S1. (b) Bar height shows relative levels of editing in the 36-bp sequence, as predicted by the eight-term model for hADAR1. The 36-bp dsRNA is shown below as a free molecule, or bounded by internal loops (L4) or additional contiguous base pairs (L0). Published patterns of editing in the three dsRNAs were determined with Xenopus laevis ADAR1, whose neighbour preferences are identical to those of hADAR1 (ref. 18). Editing in the three dsRNAs was determined by primer extension, with sites qualitatively categorized as major (I) or minor (i). Grey highlighted ends of duplexes represent regions where ADARs are unable to edit due to proximity to termini.
Figure 5
Figure 5. Analysis of an endogenous substrate reveals contributions of dsRBMs and RNA structure.
A predicted secondary structure in human 5-HT2C pre-mRNA is illustrated with the 'A'–'E' endogenous editing sites labelled. Sites are numbered from the 5′ G of the in vitro transcript (see Supplementary Methods for sequence). The 5-HT2C exon 5/intron 5 boundary is between positions 181/182 (black line). The lowest free-energy structure shown was predicted with Mfold; nucleotides predicted to have alternative pairing within 2 kcal mol−1 of the most stable pairing are green. The table shows % of population edited by different ADARs at each measurable adenosine in the illustrated structure; values are normalized to that of hADAR1 to allow comparison. Colour coding shows % editing as predicted from the eight-term model derived from data of the perfectly duplexed 795-bp dsRNA. White represents 0% predicted editing with colour gradations up to dark red (100% predicted editing).

References

    1. Bass B. L. RNA editing by adenosine deaminases that act on RNA. Annu. Rev. Biochem. 71 817–846 (2002). - PMC - PubMed
    1. Hundley H. A. & Bass B. L. ADAR editing in double-stranded UTRs and other noncoding RNA sequences. Trends Biochem. Sci. 35 377–383 (2010). - PMC - PubMed
    1. Nishikura K. Functions and regulation of RNA editing by ADAR deaminases. Annu. Rev. Biochem. 79 321–349 (2010). - PMC - PubMed
    1. Levanon E. Y. et al.. Systematic identification of abundant A-to-I editing sites in the human transcriptome. Nat. Biotechnol. 22 1001–1005 (2004). - PubMed
    1. Li J. B. et al.. Genome-wide identification of human RNA editing sites by parallel DNA capturing and sequencing. Science 324 1210–1213 (2009). - PubMed

Publication types