

Systematic and evolutionary insights derived from mtDNA COI barcode diversity in the Decapoda (Crustacea: Malacostraca)
- PMID: 21589909
- PMCID: PMC3093375
- DOI: 10.1371/journal.pone.0019449
Systematic and evolutionary insights derived from mtDNA COI barcode diversity in the Decapoda (Crustacea: Malacostraca)
Abstract
Background: Decapods are the most recognizable of all crustaceans and comprise a dominant group of benthic invertebrates of the continental shelf and slope, including many species of economic importance. Of the 17635 morphologically described Decapoda species, only 5.4% are represented by COI barcode region sequences. It therefore remains a challenge to compile regional databases that identify and analyse the extent and patterns of decapod diversity throughout the world.
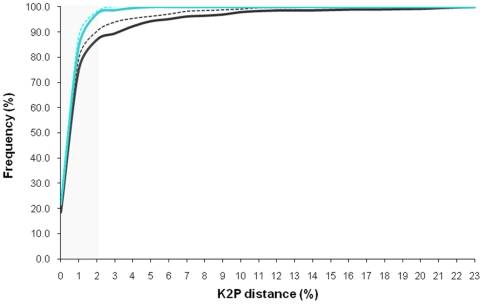
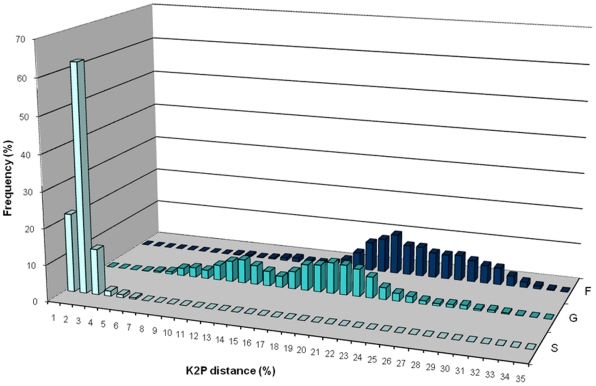
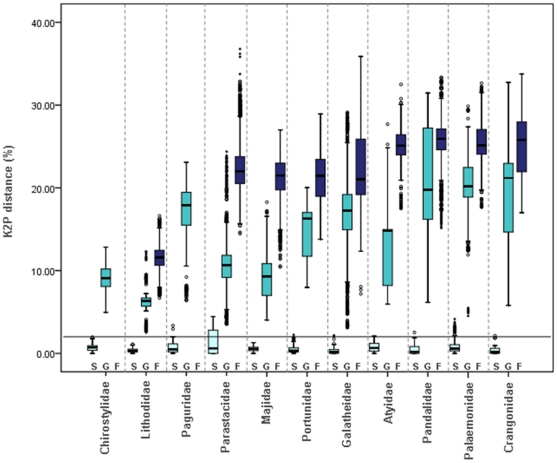
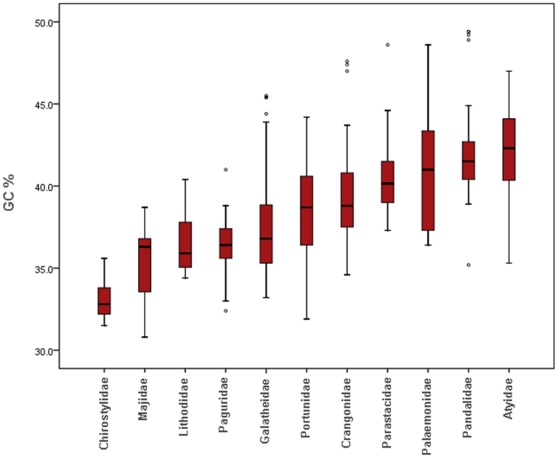
Methodology/principal findings: We contributed 101 decapod species from the North East Atlantic, the Gulf of Cadiz and the Mediterranean Sea, of which 81 species represent novel COI records. Within the newly-generated dataset, 3.6% of the species barcodes conflicted with the assigned morphological taxonomic identification, highlighting both the apparent taxonomic ambiguity among certain groups, and the need for an accelerated and independent taxonomic approach. Using the combined COI barcode projects from the Barcode of Life Database, we provide the most comprehensive COI data set so far examined for the Order (1572 sequences of 528 species, 213 genera, and 67 families). Patterns within families show a general predicted molecular hierarchy, but the scale of divergence at each taxonomic level appears to vary extensively between families. The range values of mean K2P distance observed were: within species 0.285% to 1.375%, within genus 6.376% to 20.924% and within family 11.392% to 25.617%. Nucleotide composition varied greatly across decapods, ranging from 30.8 % to 49.4 % GC content.
Conclusions/significance: Decapod biological diversity was quantified by identifying putative cryptic species allowing a rapid assessment of taxon diversity in groups that have until now received limited morphological and systematic examination. We highlight taxonomic groups or species with unusual nucleotide composition or evolutionary rates. Such data are relevant to strategies for conservation of existing decapod biodiversity, as well as elucidating the mechanisms and constraints shaping the patterns observed.
Conflict of interest statement
Figures
References
-
- Wilson EO. On global biodiversity estimates. Paleobiology. 2003;29:14–14.
-
- Blaxter M. Molecular systematics - Counting angels with DNA. Nature. 2003;421:122–124. - PubMed
-
- Wilson EO. Biodiversity in the information age. Issues in Science and Technology. 2003;19:45–46.
-
- Wilson EO. The encyclopedia of life. Trends in Ecology & Evolution. 2003;18:77–80.
-
- Butchart SHM, Walpole M, Collen B, van Strien A, Scharlemann JPW, et al. Global Biodiversity: Indicators of Recent Declines. Science. 2010;328:1164–1168. - PubMed
Publication types
MeSH terms
Substances
LinkOut - more resources
Full Text Sources
Molecular Biology Databases
Miscellaneous
