. 2012 Jan;67(1):42-9.
doi: 10.1002/mrm.22970. Epub 2011 May 16.

Calibration and validation of TRUST MRI for the estimation of cerebral blood oxygenation

Affiliations

Calibration and validation of TRUST MRI for the estimation of cerebral blood oxygenation

Hanzhang Lu et al. Magn Reson Med. 2012 Jan.

Abstract

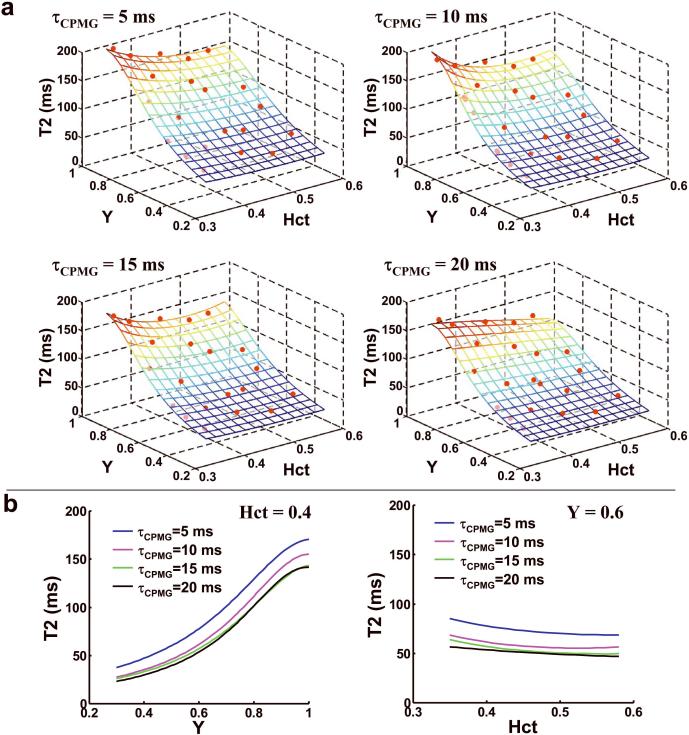
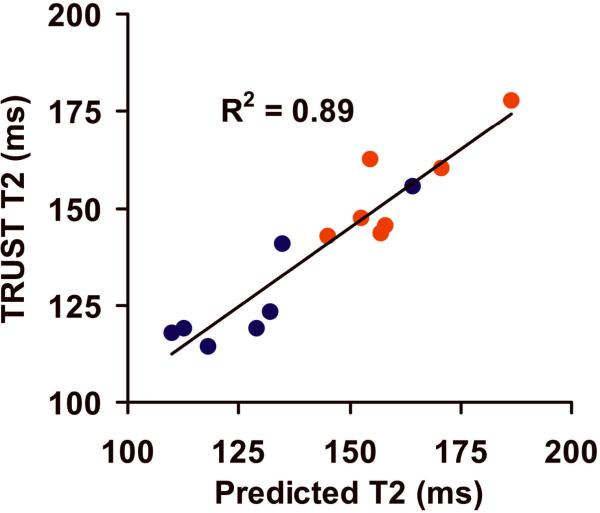
Recently, a T(2) -Relaxation-Under-Spin-Tagging (TRUST) MRI technique was developed to quantitatively estimate blood oxygen saturation fraction (Y) via the measurement of pure blood T(2) . This technique has shown promise for normalization of fMRI signals, for the assessment of oxygen metabolism, and in studies of cognitive aging and multiple sclerosis. However, a human validation study has not been conducted. In addition, the calibration curve used to convert blood T(2) to Y has not accounted for the effects of hematocrit (Hct). In this study, we first conducted experiments on blood samples under physiologic conditions, and the Carr-Purcell-Meiboom-Gill T(2) was determined for a range of Y and Hct values. The data were fitted to a two-compartment exchange model to allow the characterization of a three-dimensional plot that can serve to calibrate the in vivo data. Next, in a validation study in humans, we showed that arterial Y estimated using TRUST MRI was 0.837 ± 0.036 (N=7) during the inhalation of 14% O2, which was in excellent agreement with the gold-standard Y values of 0.840 ± 0.036 based on Pulse-Oximetry. These data suggest that the availability of this calibration plot should enhance the applicability of T(2) -Relaxation-Under-Spin-Tagging MRI for noninvasive assessment of cerebral blood oxygenation.


Figures

Figure 1
Figure 1
Relationship between T2, Y, and Hct in blood samples. (a) T2 values of blood samples as a function of oxygenation (Y) and hematocrit (Hct) at four different τCPMG. The symbols indicated the experimental data points and the mesh showed the model-fitted surface. The surface was displayed with partial transparency thus the symbols below the surface can also be seen, although with a slightly darker color. The values of Y and Hct were written in fractions. The analytical expressions of the surfaces are listed in Equations [1–4] and Table 1. (b) Two-dimensional plots between T2 and Y at a fixed Hct of 0.4 and between T2 and Hct at a fixed Y of 0.6. Each plot shows curves at four different τCPMG values.
Figure 2
Figure 2
Representative images from TRUST MRI. The scan acquired control and labeled images in an interleaved fashion. Each image type was acquired at four different T2-weightings as indicated by the effective TE (eTE). The difference images were calculated from the subtractions. The difference images are displayed in a different color scale because their signal intensities are considerably lower than the control and labeled images.
Figure 3
Figure 3
Relationship between arterial blood T2 and hematocrit in humans during normoxia. The T2 was measured using TRUST MRI and the Hct was determined with a centrifuge. The arterial blood was close to full oxygenation under this condition (Ya=0.973±0.006). The T2 was therefore primarily dependent upon the Hct levels. The solid line represents the linear fitting curve. This plot is based entirely on the in vivo data, and did not involve the calibration data.
Figure 4
Figure 4
Scatter plot between TRUST-determined blood T2 values and those predicted using the calibration plot with individual Ya and Hct. Red symbols indicate normoxia data points. Blue symbols indicated hypoxia data points. The solid line represents the linear fitting curve.

References

    1. Kety SS, Schmidt CF. The Effects of Altered Arterial Tensions of Carbon Dioxide and Oxygen on Cerebral Blood Flow and Cerebral Oxygen Consumption of Normal Young Men. J Clin Invest. 1948;27:484–492. - PMC - PubMed
    1. Mintun MA, Raichle ME, Martin WR, Herscovitch P. Brain oxygen utilization measured with O-15 radiotracers and positron emission tomography. J Nucl Med. 1984;25:177–187. - PubMed
    1. Xu F, Ge Y, Lu H. Noninvasive quantification of whole-brain cerebral metabolic rate of oxygen (CMRO2) by MRI. Magn Reson Med. 2009;62:141–148. - PMC - PubMed
    1. Jain V, Langham MC, Wehrli FW. MRI estimation of global brain oxygen consumption rate. J Cereb Blood Flow Metab. 2010;30:1598–1607. - PMC - PubMed
    1. van Zijl PC, Eleff SM, Ulatowski JA, Oja JM, Ulug AM, Traystman RJ, Kauppinen RA. Quantitative assessment of blood flow, blood volume and blood oxygenation effects in functional magnetic resonance imaging. Nat Med. 1998;4:159–167. - PubMed

Publication types