

Detection of early response to temozolomide treatment in brain tumors using hyperpolarized 13C MR metabolic imaging
- PMID: 21590996
- PMCID: PMC4983457
- DOI: 10.1002/jmri.22563
Detection of early response to temozolomide treatment in brain tumors using hyperpolarized 13C MR metabolic imaging
Abstract
Purpose: To demonstrate the feasibility of using DNP hyperpolarized [1-(13)C]-pyruvate to measure early response to temozolomide (TMZ) therapy using an orthotopic human glioblastoma xenograft model.
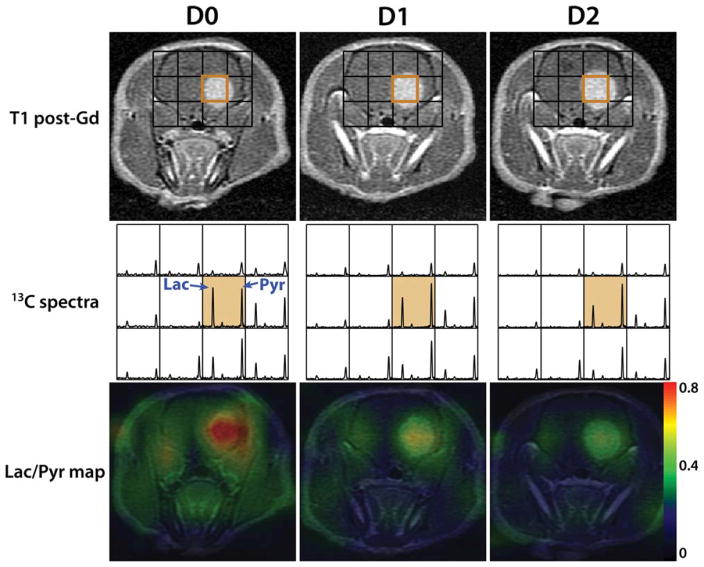
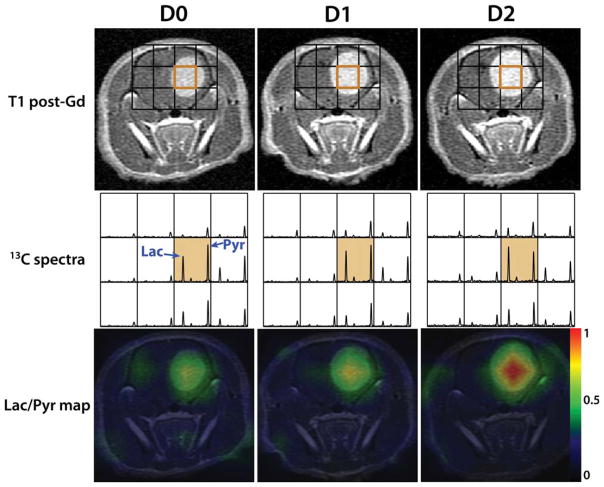
Materials and methods: Twenty athymic rats with intracranial implantation of human glioblastoma cells were divided into two groups: one group received an oral administration of 100 mg/kg TMZ (n = 10) and the control group received vehicle only (n = 10). (13)C 3D magnetic resonance spectroscopic imaging (MRSI) data were acquired following injection of 2.5 mL (100 mM) hyperpolarized [1-(13)C]-pyruvate using a 3T scanner prior to treatment (day D0), at D1 (days from treatment) or D2.
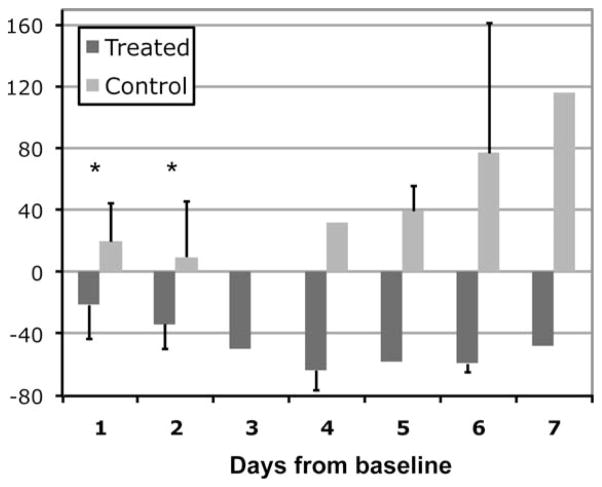
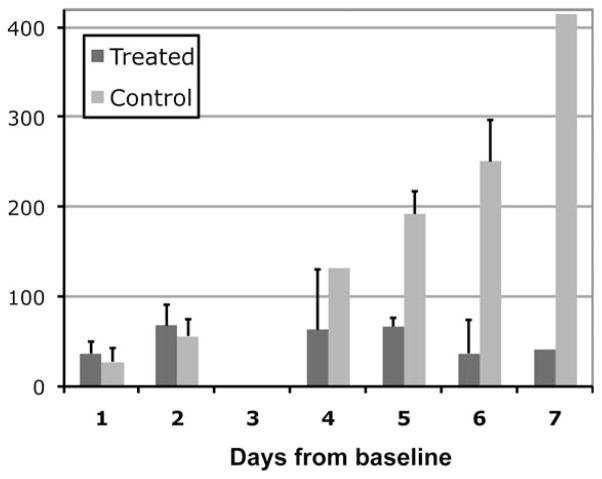
Results: Tumor metabolism as assessed by the ratio of lactate to pyruvate (Lac/Pyr) was significantly altered at D1 for the TMZ-treated group but tumor volume did not show a reduction until D5 to D7. The percent change in Lac/Pyr from baseline was statistically different between the two groups at D1 and D2 (P < 0.008), while percent tumor volume was not (P > 0.2).
Conclusion: The results from this study suggest that metabolic imaging with hyperpolarized [1-(13)C]-pyruvate may provide a unique tool that clinical neuro-oncologists can use in the future to monitor tumor response to therapy for patients with brain tumors.
Copyright © 2011 Wiley-Liss, Inc.
Figures
References
-
- Macdonald DR, Cascino TL, Schold SC, Jr, Cairncross JG. Response criteria for phase II studies of supratentorial malignant glioma. J Clin Oncol. 1990;8:1277–1280. - PubMed
-
- Walecki J, Tarasow E, Kubas B, et al. Hydrogen-1 MR spectroscopy of the peritumoral zone in patients with cerebral glioma: assessment of the value of the method. Acad Radiol. 2003;10:145–153. - PubMed
-
- Balmaceda C, Critchell D, Mao X, et al. Multisection 1H magnetic resonance spectroscopic imaging assessment of glioma response to chemotherapy. J Neurooncol. 2006;76:185–191. - PubMed
-
- Leimgruber A, Ostermann S, Yeon EJ, et al. Perfusion and diffusion MRI of glioblastoma progression in a four-year prospective temozolomide clinical trial. Int J Radiat Oncol Biol Phys. 2006;64:869–875. - PubMed
-
- Akella NS, Twieg DB, Mikkelsen T, et al. Assessment of brain tumor angiogenesis inhibitors using perfusion magnetic resonance imaging: quality and analysis results of a phase I trial. J Magn Reson Imaging. 2004;20:913–922. - PubMed
Publication types
MeSH terms
Substances
Grants and funding
LinkOut - more resources
Full Text Sources
Medical
