. 2011 Jul 7;115(26):8371-80.
doi: 10.1021/jp201235m. Epub 2011 May 17.

Bioelectronic delivery of electrons to cytochrome P450 enzymes

Affiliations

Bioelectronic delivery of electrons to cytochrome P450 enzymes

Sadagopan Krishnan et al. J Phys Chem B. .

Abstract

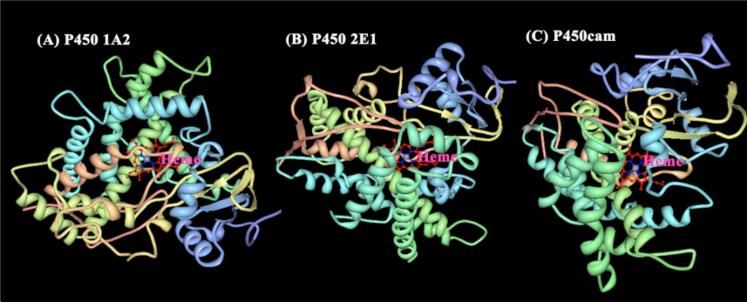
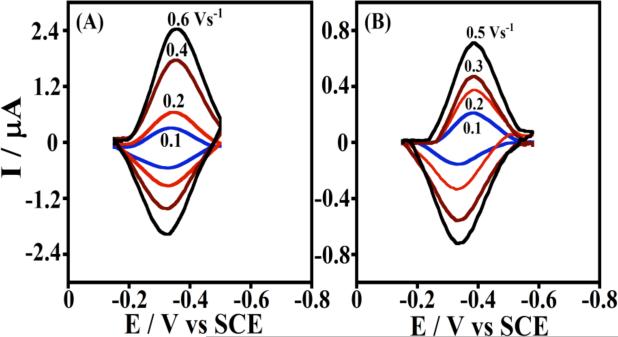
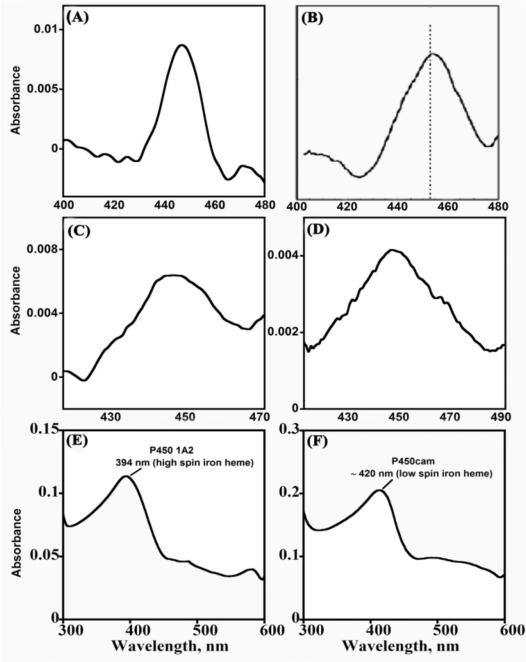
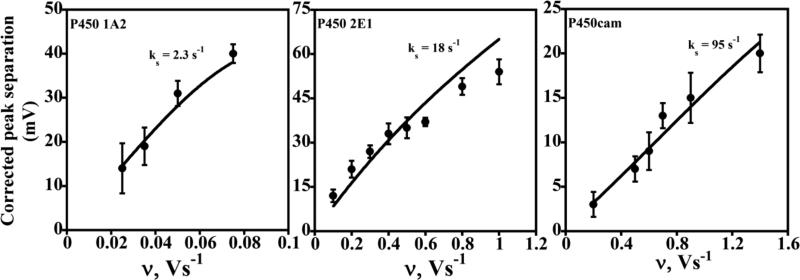
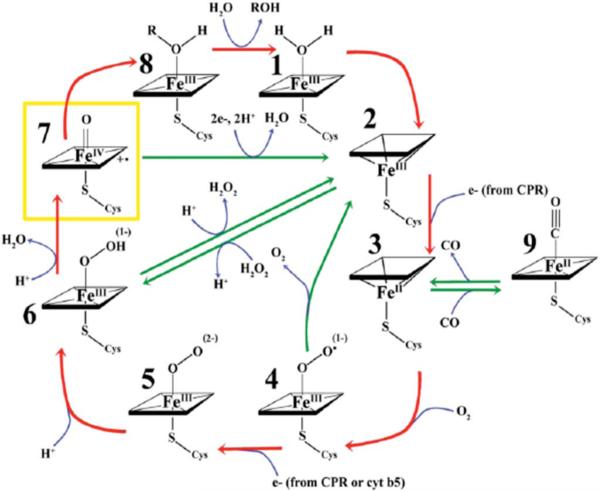
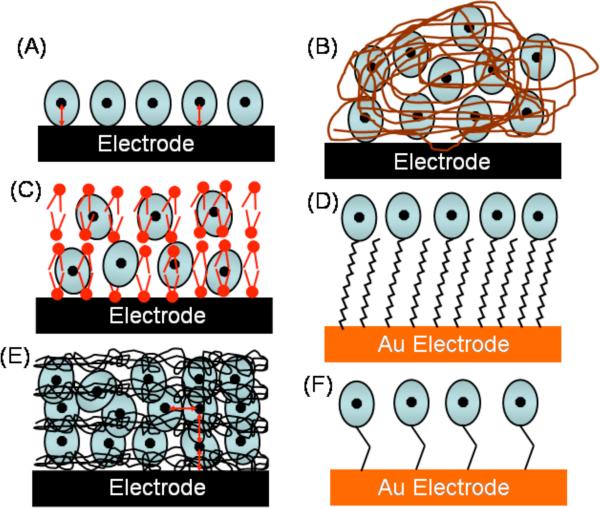
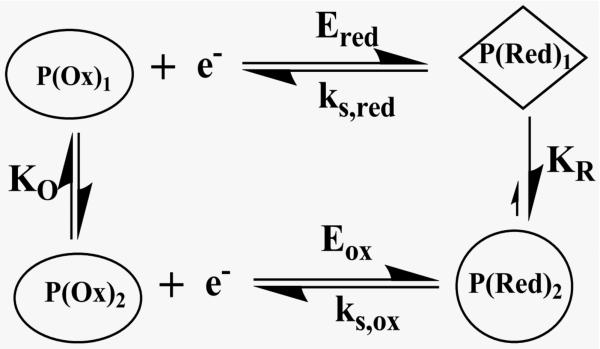
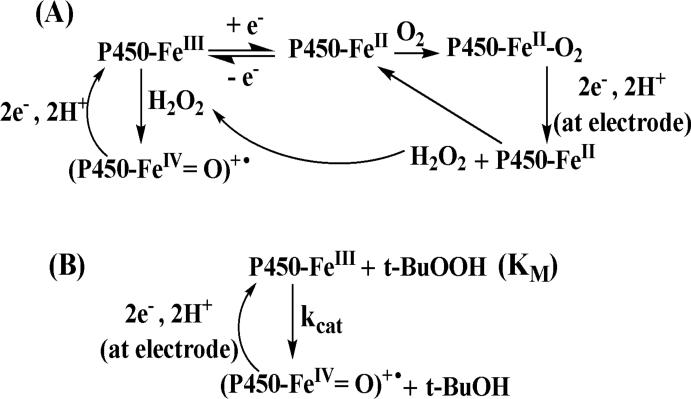
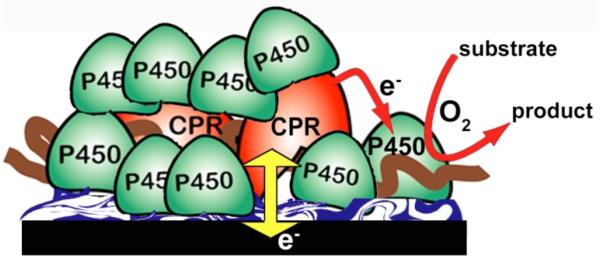
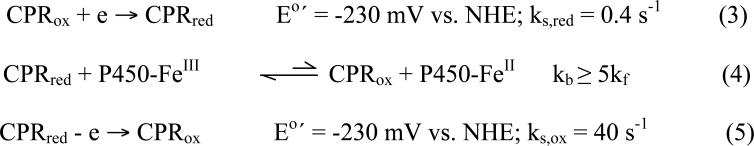
Cytochrome P450s (cyt P450s) are the major oxidative enzymes in human oxidative metabolism of drugs and xenobiotic chemicals. In nature, the iron heme cyt P450s utilize oxygen and electrons delivered from NADPH by a reductase enzyme to oxidize substrates stereo- and regioselectively. Significant research has been directed toward achieving these events electrochemically. This Feature Article discusses the direct electrochemistry of cyt P450s in thin films and the utilization of such films for electrochemically driven biocatalysis. Maintaining and confirming structural integrity and catalytic activity of cyt P450s in films is an essential feature of these efforts. We highlight here our efforts to elucidate the influence of iron heme spin state and secondary structure of human cyt P450s on voltammetric and biocatalytic properties, using methodologies to quantitatively describe the dynamics of these processes in thin films. We also describe the first cyt P450/reductase films that accurately mimic the natural biocatalytic pathway and show how they can be used with voltammetry to elucidate key mechanistic features. Such bioelectronic cyt P450 systems have high value for future drug development, toxicity screening, fundamental investigations, and chemical synthesis systems.


Figures

Figure 1
Figure 1
X-ray crystal structures of human cyt P450s (A) 1A2 (PDB:2HI4); (B) 2E1 (PDB:3E4E); and (C) bacterial cyt P450cam (PDB:2CPP). Structures were obtained from the protein data bank.
Figure 2
Figure 2
Background subtracted cyclic voltammograms of LbL films on PG electrodes in anaerobic 50 mM potassium phosphate buffer + 0.1 M NaCl, pH 7.0: (A) cyt P450 2E1/polyion and (B) cyt P450cam/polyion. Reproduced with permission from ref. , American Chemical Society, copyright 2009.
Figure 3
Figure 3
Spectra of cyt P450 films on aminosilane-functionalized silica slides in pH 7.0 buffer. (A to D) Difference spectra after reducing enzyme to ferrous form and adding CO: (A) polyion/cyt P450 1A2; (B) polyion/cyt P450cam; (C) Cyt P450 1A2/CPR films reduced directly with sodium dithionite or (D) reduced via CPR using 1 mM NADPH. (E and F) Ferric enzyme film spectra: (E) Ferric polyion/cyt P450 1A2 showing high spin heme iron and (F) ferric polyion/cyt P450cam showing low spin heme iron of P450cam in LbL films. Reproduced with permission (A), (E) and (F) from ref. ; (B) from ref. , American Chemical Society, copyright 2009 & 2007; (C) & (D) from ref. , American Chemical Society, copyright 2011.
Figure 4
Figure 4
Influence of cyclic voltammetry scan rate for different cyt P450/polyion LbL films (as denoted on each plot) on experimental (•) peak separation (ΔEp) corrected for scan rate independent non-kinetic contribution. The theoretical lines were computed for Butler-Volmer theory for the rate constant (ks) values shown for transfer coefficient α= 0.5. Reproduced with permission from ref. , American Chemical Society, copyright 2009.
Figure 5
Figure 5
Oxidation and reduction peak potentials vs. log scan rate for cyt P450 films from CVs of LbL films of (A) Polyion/P450 1A2; (B) Polyion/P450 2E1; and (C) Polyion/P450cam. Experimental oxidation (red diamonds) and reduction (blue circles) peak potentials are shown along with the best fit simulations (lines) obtained by using an E reduction/E oxidation mechanism with the reduction (ks,red) and oxidation (ks,ox) rate constants shown in each plot. Reproduced with permission from ref. , American Chemical Society, copyright 2009.
Figure 6
Figure 6
Rotating disk voltammograms of cyt P450 films on PG electrodes for t-BuOOH reduction in anaerobic potassium phosphate buffer (pH 7.0) at 25 °C. Limiting currents (IL) for increasing t-BuOOH concentration (in μM) are shown for (A) polyion/P450 2E1 and (B) polyion/P450cam LbL films. (C) Plots of apparent enzyme turnover rate (IL/Γ) vs. t-BuOOH concentration for cyt P450 films shown along with control myoglobin (Mb) and catalase films. Symbols are experimental data and solid lines represent Michaelis-Menten fit (eq. 2) from which kinetic parameters kcat and KM were obtained. Reproduced from ref. with permission from American Chemical Society, copyright 2009.
Figure 7
Figure 7. Experimental and simulated voltammetry for films of cyt P450 1A2 and CPR microsomes
(A) Background subtracted CVs of a, CPR films at 0.3 V s-1 with no cyt P450, and b-d, cyt P450 1A2 + CPR films at scan rates (b) 0.1, (c) 0.2, and (d) 0.3 Vs-1. (B) background subtracted CVs: a, polyion film, and b-c, cyt P450 1A2 film with no CPR at (b) 0.1 and (c) 0.2 V s-1. (C) Digitally simulated theoretical CVs corresponding to a, reversible electron transfer for only CPR film at 0.3 Vs-1, and b-d, the ErCEo-model and parameters in Scheme 6 for cyt P450 1A2 + CPR films at scan rates (b) 0.1, (c) 0.2, and (d) 0.3 V s-1 showing excellent agreement with the experimental CVs in Figure 7A. (D) Influence of scan rate on oxidation (blue circles) and reduction (red diamonds) peak potentials for cyt P450 1A2 + CPR films plotted with theoretical peak potentials (lines) simulated using the ErCEo model. Reproduced with permission from ref. , American Chemical Society, copyright 2011.
Figure 8
Figure 8. Catalytic rotating disk voltammetry of Cyt P450 + CPR films
Increase in steady state current with increasing concentration of substrate 4-(methylnitrosamino)-1-(3-pyridyl)-1-butanone (NNK) in pH 7.0 buffer. Reproduced with permission from ref. , American Chemical Society, copyright 2011.
Scheme 1
Scheme 1
Proposed cyt P450 catalytic cycle., ,
Scheme 2
Scheme 2
Immobilization strategies for protein film voltammetry and biocatalysis: (A) adsorbed protein film; (B) cast films of protein and polyions; (C) cast films of proteins and insoluble lipids; (D) proteins on self-assembled alkylthiol monolayers on Au; (E) LbL films of enzyme and polyions; (F) covalently immobilized proteins.
Scheme 3
Scheme 3
Modified square scheme for thin film voltammetry of cyt P450s.
Scheme 4
Scheme 4
Pathways for biocatalytic activation of cyt P450s by peroxides: (A) oxygen reduction formed peroxide by cyt P450s on electrodes; (B) t-butyl hydroperoxide (t-BuOOH) reduction by cyt P450s.
Scheme 5
Scheme 5
Microsomal CPR/Cyt P450 films that mimic the natural catalytic pathway on an electrode.
Scheme 6
Scheme 6
ErCEo simulation model for CVs of cyt P450s + CPR.

Similar articles

Cited by

References

    1. Schenkman JB, Greim H, editors. Cytochrome P450. Springer-Verlag; Berlin: 1993.
    1. Ortiz de Montellano PR, editor. Cytochrome P450. Kluwer/Plenum; New York: 2005.
    1. Kramer JA, Sagartz JE, Morris DL. Nature Rev. Drug Discov. 2007;6:636–649. - PubMed
    1. Sansen S, Yano JK, Reynald RL, Schoch GA, Griffin KJ, Stout CD, Johnson EF. J. Biol. Chem. 2007;282:14348–14355. - PubMed
    1. Porubsky PR, Meneely KM, Scott EE. J. Biol. Chem. 2008;283:33698–33707. - PMC - PubMed

Publication types

Substances