. 2011 May 18:11:86.
doi: 10.1186/1471-2229-11-86.

Identification of tissue-specific, abiotic stress-responsive gene expression patterns in wine grape (Vitis vinifera L.) based on curation and mining of large-scale EST data sets

Affiliations

Identification of tissue-specific, abiotic stress-responsive gene expression patterns in wine grape (Vitis vinifera L.) based on curation and mining of large-scale EST data sets

Richard L Tillett et al. BMC Plant Biol. .

Abstract

Background: Abiotic stresses, such as water deficit and soil salinity, result in changes in physiology, nutrient use, and vegetative growth in vines, and ultimately, yield and flavor in berries of wine grape, Vitis vinifera L. Large-scale expressed sequence tags (ESTs) were generated, curated, and analyzed to identify major genetic determinants responsible for stress-adaptive responses. Although roots serve as the first site of perception and/or injury for many types of abiotic stress, EST sequencing in root tissues of wine grape exposed to abiotic stresses has been extremely limited to date. To overcome this limitation, large-scale EST sequencing was conducted from root tissues exposed to multiple abiotic stresses.

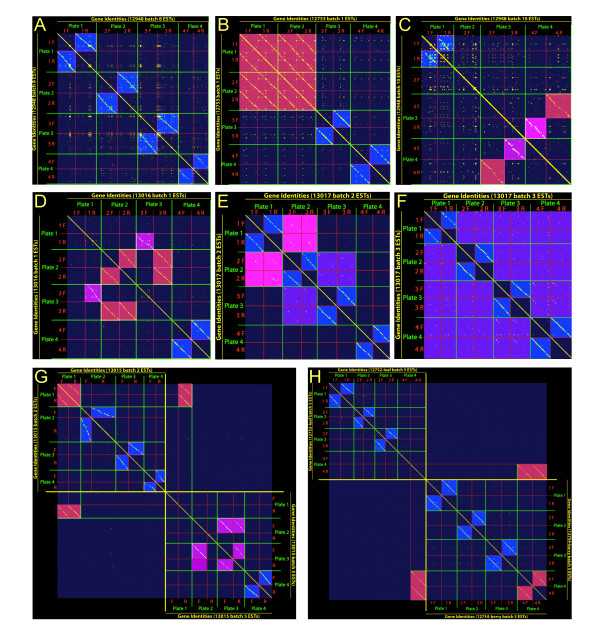
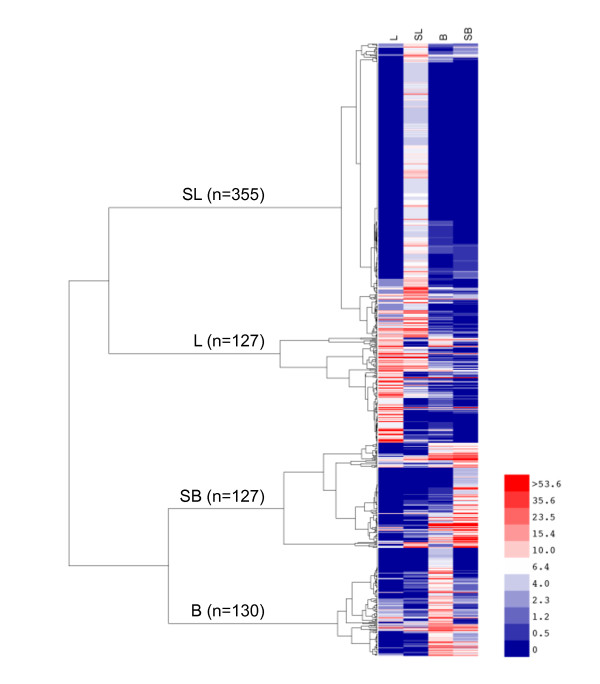
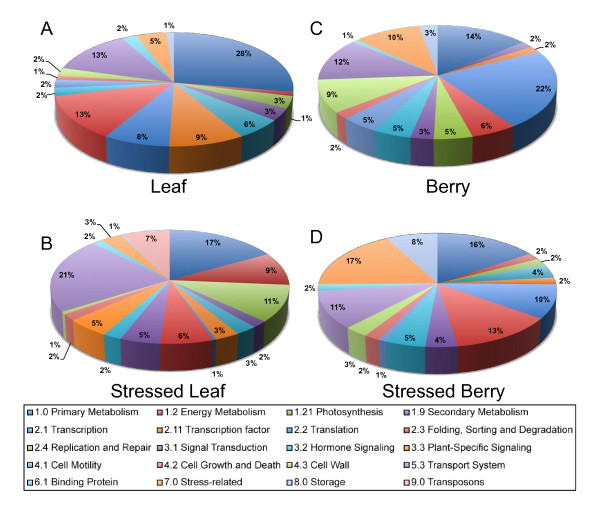
Results: A total of 62,236 expressed sequence tags (ESTs) were generated from leaf, berry, and root tissues from vines subjected to abiotic stresses and compared with 32,286 ESTs sequenced from 20 public cDNA libraries. Curation to correct annotation errors, clustering and assembly of the berry and leaf ESTs with currently available V. vinifera full-length transcripts and ESTs yielded a total of 13,278 unique sequences, with 2302 singletons and 10,976 mapped to V. vinifera gene models. Of these, 739 transcripts were found to have significant differential expression in stressed leaves and berries including 250 genes not described previously as being abiotic stress responsive. In a second analysis of 16,452 ESTs from a normalized root cDNA library derived from roots exposed to multiple, short-term, abiotic stresses, 135 genes with root-enriched expression patterns were identified on the basis of their relative EST abundance in roots relative to other tissues.

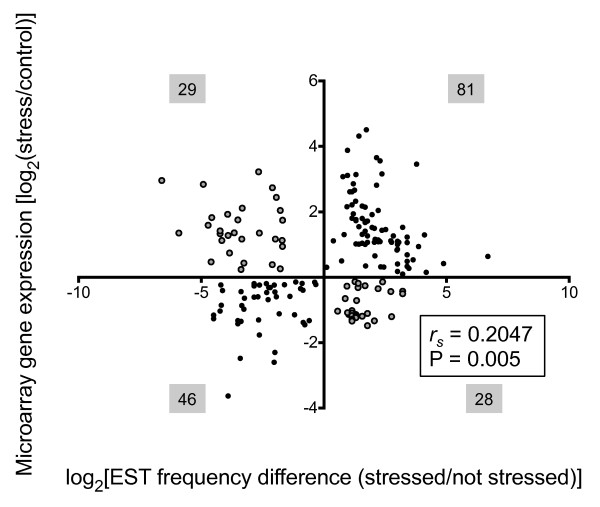
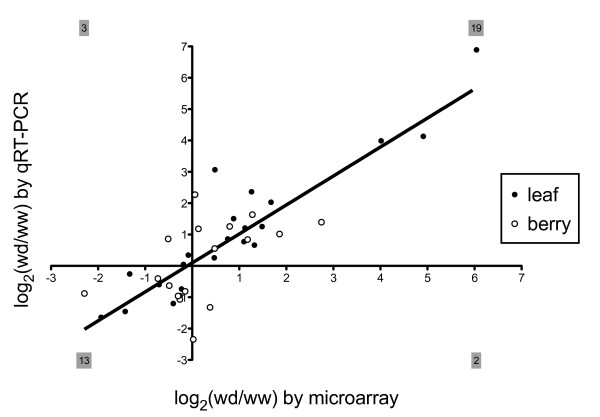
Conclusions: The large-scale analysis of relative EST frequency counts among a diverse collection of 23 different cDNA libraries from leaf, berry, and root tissues of wine grape exposed to a variety of abiotic stress conditions revealed distinct, tissue-specific expression patterns, previously unrecognized stress-induced genes, and many novel genes with root-enriched mRNA expression for improving our understanding of root biology and manipulation of rootstock traits in wine grape. mRNA abundance estimates based on EST library-enriched expression patterns showed only modest correlations between microarray and quantitative, real-time reverse transcription-polymerase chain reaction (qRT-PCR) methods highlighting the need for deep-sequencing expression profiling methods.


Figures

Figure 1
Figure 1
Correcting erroneous EST identities in bi-directionally sequenced leaf and berry libraries with dot plots. Contig names assigned to ESTs from bi-directionally sequenced libraries were plotted in two dimensions to identify "motifs of self-similarity" analogous to dot-plot sequence alignments. The sequencing batch, plate order, and well position were recapitulated from dbEST submission files as a sequential list arranged as 1f, 1r, 2f, 2r, 3f, 3r, 4f, 4r, and plotted against itself in the x and y axes. A) Diagonals indicate four sets of plates from Library ID 12948, batch 8 are named and paired correctly (blue); B) Library ID 12753, batch 1, all combinations of plates 1f, 1r, 2f and 2r are duplicates (salmon), plates 3 and 4 are correctly paired (blue); C) Library ID 12948, batch 10 plate 1f matches 1r (blue), plate 2f and 2r did not match, plate 3f matches 4r (salmon), 4f matches 3r (magenta); D) Berry Library ID 13016, batch 1, plate 3r matches with 2f and 2r (salmon), 1r matches with 3f (magenta), 1f has no match, plate 4 is paired correctly (blue); E) Library ID 13017, batch 2, Plates 1 and 2 display partial matching (pink), plates 2 and 3 also partially match (purple); F) Berry Library ID 13017 batch 3, partial matching between all four plates (purple); G) Berry Library ID 13015, batch 2, plate 1 matches batch 5 plate 1r (salmon); other plate match errors are also apparent in lower right hand quandrant (magenta); H), Leaf Library ID 12752, batch 5, plate 4r matches Berry Library ID 12754, batch 5, plates 4fr (salmon).
Figure 2
Figure 2
Heat-map and two-dimensional hierarchical clustering of EST frequencies in 739 differentially expressed genes among cDNA libraries from stressed and unstressed leaves and berries. Color shown is given in normalized EST frequency per 10,000 ESTs, scale from blue at f = 0 to white to red at f > 53.6 (inset). Four major clusters that correspond to single-type predominance are labeled (with the number of genes within the cluster) stressed leaf (SL), leaf (L), Stressed Berry (SB), Berry (B).
Figure 3
Figure 3
Functional categories of differentially expressed transcripts identified by EST frequency analysis. Functional assignments of genes found in the four major clusters of differentially expressed genes. At the chosen hierarchy depth / distance, the four clusters correspond, in large part, to maximal frequencies within A) Leaf, B) Stressed Leaf, C) Berry, and D) Stressed Berry cDNA libraries. Assignments are based upon the data available at VitisNet http://www.sdstate.edu/aes/vitis/pathways.cfm[93]. Chart colors progress clockwise from the top.
Figure 4
Figure 4
Scatterplot of EST frequencies compared with microarray expression levels. Log2-transformed frequency distributions of ESTs from mixed stressed leaf (e.g., water deficit, NaCl, heat, high light) and berry (water deficit stress) and unstressed leaf and berry tissue were compared to 184 Affymetrix® Vitis GeneChip® log2-abundance ratios of chilling, osmotic (mannitol), and salt stress, and water-deficit-stressed leaf [10,31] and water-deficit-stressed whole berry tissues [24]. Differences in gene model EST frequencies between stressed and unstressed library pairs (i.e., stressed berries compared with unstressed berries) were plotted along a log2 scale as well. The Spearman rank correlation, rs, was 0.2047, with likelihood P = 0.005). Filled and gray circles indicate agreement and disagreement in directional concordance, respectively. The total number of genes present in each Cartesian quadrant are shown in gray-shaded boxes.
Figure 5
Figure 5
Expression of stress-related genes in V. vinifera leaves and berries as detected by microarray and qRT-PCR. Log2-transformed values of Affymetrix® Vitis GeneChip® signal intensities (x-axis) and real time-RT-PCR expression log2-ratios (y-axis) of 22 genes in leaf tissue (filled circles), as well as 17 genes in berry tissue (open circles) of water deficit (wd) and well watered (ww) vines. A linear regression has slope m = 0.92 and Pearson correlation r = 0.85 for the total data set of 39 pairs of log2-ratios [10,24]. The totals of genes present in each Cartesian quadrant are shown in gray-shaded boxes. qRT-PCR data were derived from three biological replicates.
Figure 6
Figure 6
Functional categories of genes in the VVM root cDNA library and within a root-enriched subset. Functional assignments for genes from the Cabernet Sauvignon root EST library, VVM, were made using VitisNet annotation. A) Proportion of genes identified in VVM for which functions are unclear, unknown, or are known as described within VitisNet annotation; B) Classification of the functions of all 4505 genes from the above "known" category in VVM; C) the functional assignments of 135 transcripts estimated to be differentially expressed in root tissues from the Audic-Claverie test [60].
Figure 7
Figure 7
Expression of candidate root-specific genes in roots and shoots of Cabernet Sauvignon. qRT-PCR analysis of ten selected transcripts in shoot (white bars) and root (gray bars) tissues. Transcript abundances derived from three biological replicates were normalized to an actin reference gene and fold differences were standardized to shoot expression values. Error bars represent standard error. Two-way ANOVA (gene, tissue) was performed followed by post-test Bonferroni-corrected t-statistics. Significant differences in gene expression (root compared with shoot) are indicated by asterisks. * denotes p < 0.05; ** denotes p < 0.01; *** denotes p < 0.001. Fold-differences are drawn on log scale. The tested genes are listed below in the order that they appear on the graph from left to right, with the number of root ESTs compared with non-root ESTs in parentheses. Myb family transcription factor-like b, (7 compared with 1); Nitrate reductase 2, (9 compared with 3); NGATHA1 transcription factor, (5 compared with 0); (AP2/ERF transcription factor, 6 compared with 0); Myb family transcription factor-like a, (5 compared with 0); Flavonol 3-O-glucosyltransferase, (10 compared with 1); Cinnamaldehyde dehydrogenase, (9 compared with 1); (E, E)-alpha-Farnesene synthase, (23 compared with 0); Resveratrol O-methyltransferase, (30 compared with 0); Aquaporin TIP1;4, (57 compared with 2).

Similar articles

Cited by

References

    1. Jaillon O, Aury J, Noel B, Policriti A, Clepet C, Casagrande A, Choisne N, Aubourg S, Vitulo N, Jubin C, Vezzi A, Legeai F, Hugueney P, Dasilva C, Horner D, Mica E, Jublot D, Poulain J, Bruyère C, Billault A, Segurens B, Gouyvenoux M, Ugarte E, Cattonaro F, Anthouard V, Vico V, Del Fabbro C, Alaux M, Di Gaspero G, Dumas V. et al.The grapevine genome sequence suggests ancestral hexaploidization in major angiosperm phyla. Nature. 2007;449:463–467. doi: 10.1038/nature06148. - DOI - PubMed
    1. Velasco R, Zharkikh A, Troggio M, Cartwright D, Cestaro A, Pruss D, Pindo M, Fitzgerald L, Vezzulli S, Reid J, Malacarne G, Iliev D, Coppola G, Wardell B, Micheletti D, Macalma T, Facci M, Mitchell J, Perazzolli M, Eldredge G, Gatto P, Oyzerski R, Moretto M, Gutin N, Stefanini M, Chen Y, Segala C, Davenport C, Demattè L, Mraz A. et al.A high quality draft consensus sequence of the genome of a heterozygous grapevine variety. PLoS ONE. 2007;2:e1326. doi: 10.1371/journal.pone.0001326. - DOI - PMC - PubMed
    1. Scalabrin S, Troggio M, Moroldo M, Pindo M, Felice N, Coppola G, Prete G, Malacarne G, Marconi R, Faes G, Jurman I, Grando S, Jesse T, Segala C, Valle G, Policriti A, Fontana P, Morgante M, Velasco R. Physical mapping in highly heterozygous genomes: a physical contig map of the Pinot Noir grapevine cultivar. BMC Genomics. 2010;11:204. doi: 10.1186/1471-2164-11-204. - DOI - PMC - PubMed
    1. Romieu C, Kappel C, Delrot S. In: Genetics, Genomics and Breeding of Grapes. Adam-Blondon A-F, Martinez-Zapata J, Kole C, editor. New York, NY: CRC Press; 2011. Functional genomics: Closed system approaches for transcriptome analysis; pp. 270–298.
    1. Tillett R, Cushman J. In: Genetics, Genomics and Breeding of Grapes. Adam-Blondon A-F, Martinez-Zapata J, Kole C, editor. Enfield, NH: Science Publishers; 2011. Vitis functional genomics: Open systems for transcriptome analysis; pp. 235–269.

MeSH terms