. 2011 Jun 1;203(11):1668-78.
doi: 10.1093/infdis/jir165.

B and T lymphocyte attenuator down-regulation by HIV-1 depends on type I interferon and contributes to T-cell hyperactivation

Affiliations

B and T lymphocyte attenuator down-regulation by HIV-1 depends on type I interferon and contributes to T-cell hyperactivation

Zheng Zhang et al. J Infect Dis. .

Abstract

Background: Nonspecific T-cell hyperactivation is the main driving force for human immunodeficiency virus (HIV)-1 disease progression, but the reasons why the excess immune response is not properly shut off are poorly defined.

Methods: Eighty-five HIV-1-infected individuals were enrolled to characterize B and T lymphocyte attenuator (BTLA) expression and function. Infection and blockade assays were used to dissect the factors that influenced BTLA signaling in vitro.

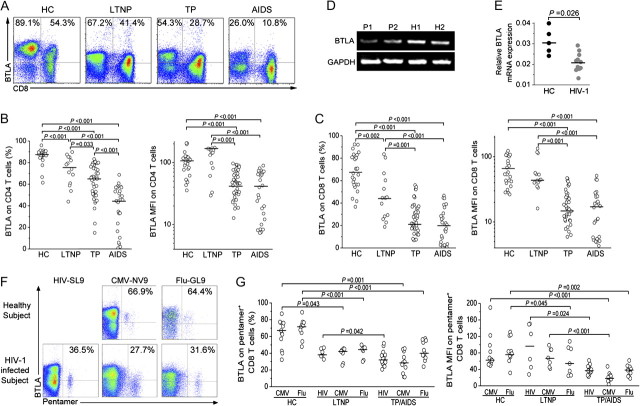
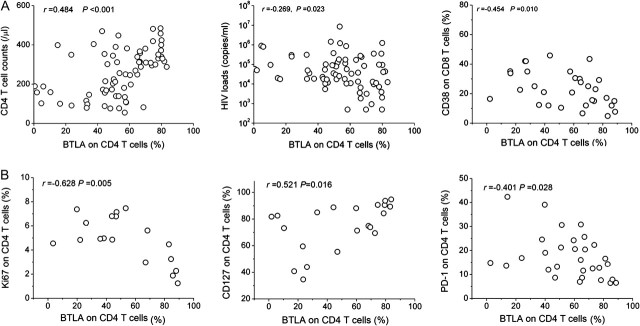
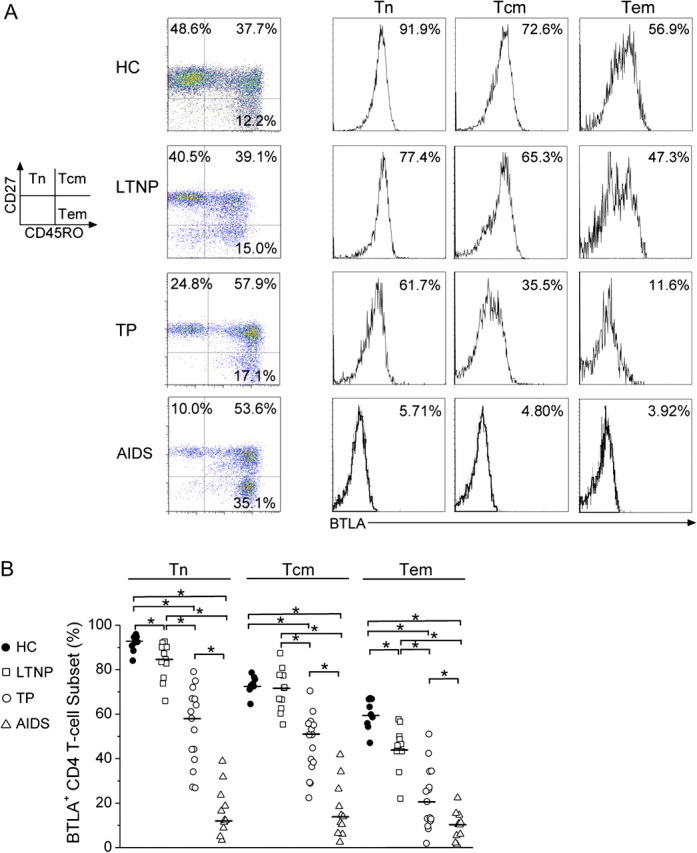
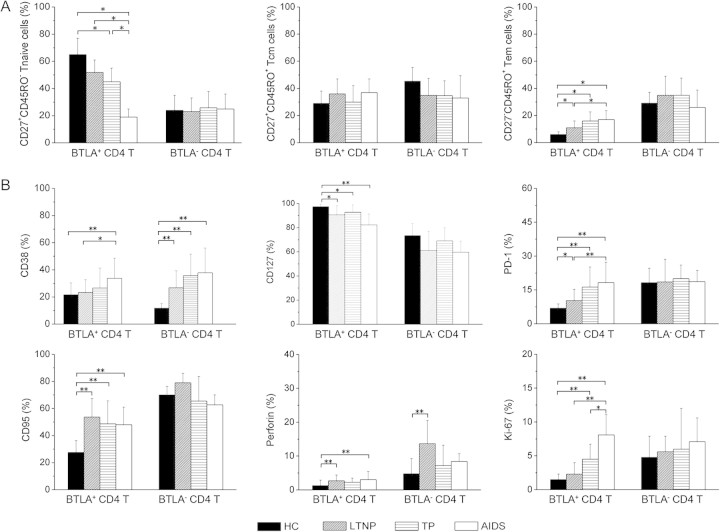
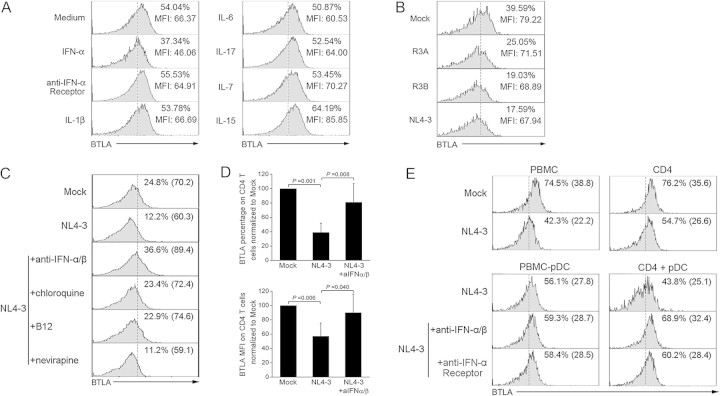
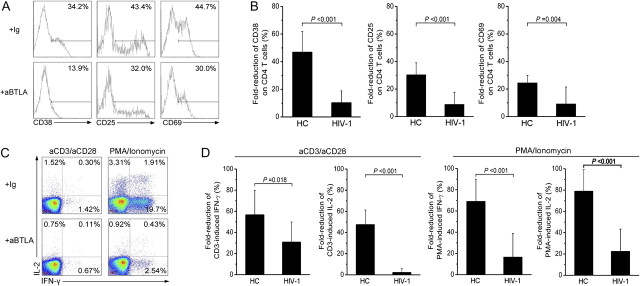
Results: BTLA expression on overall CD4(+) and CD8(+) T cells was progressively decreased in HIV-1 infection, which was directly correlated with disease progression and CD4(+) T-cell differentiation and activation. BTLA(+)CD4(+) T cells from HIV-1-infected patients also displayed an altered immune status, which was indicated by reduced expression of naive markers but increased activation and exhaustion markers. Cross-linking of BTLA can substantially decrease CD4(+) T-cell activation in vitro. This responsiveness of CD4(+) T cells to BTLA-mediated inhibitory signaling was further found to be impaired in HIV-1-infected patients. Furthermore, HIV-1 NL4-3 down-regulated BTLA expression on CD4(+) T cells dependent on plasmacytoid dendritic cell (pDC)-derived interferon (IFN)-α. Blockade of IFN-α or depletion of pDCs prevents HIV-1-induced BTLA down-regulation.

Conclusions: HIV-1 infection potentially impairs BTLA-mediated signaling dependent on pDC-derived IFN-α, which may contribute to broad T-cell hyperactivation induced by chronic HIV-1 infection.


Figures

Figure 1.
Figure 1.
B and T lymphocyte attenuator (BTLA) expression on human T cells during chronic human immunodeficiency virus (HIV)-1–infection. A, Representative dot plots of BTLA staining in T cells isolated from healthy subjects and HIV-1–infected individuals. Values in the upper-left and upper-right quadrants represent the percentages of CD4+ T cells and CD8+ T cells that express BTLA, respectively. B and C, Statistical analysis of BTLA percentage and mean fluorescence intensity in CD4+ T cells (B) and CD8+ T cells (C) in healthy control subjects (HC; n = 26), long-term nonprogressors (LTNP; n = 14), typical progressors (TP; n = 44), and patients with AIDS (n = 27). D, Representative gel analysis of semi-quantitative real-time polymerase chain reaction products of BTLA mRNA transcripts extracted from purified CD4+ T cells from 2 HIV-1 infected TPs and 2 HCs. P, patient; H, healthy subject. E, Statistical analysis of BTLA mRNA expression in CD4+ T cells from HIV-1-infected TPs/patients with AIDS (n = 11) and HCs (n = 5). F, Representative dot plots of BTLA-expressing HIV-, cytomegalovirus (CMV)-, or influenza virus–specific CD8+ T cells from HIV-1-infected patients and HCs. Values in the upper-right quadrant represent the percentage of pentamer-positive CD8+ T cells that express BTLA. G, The frequency and mean fluorescence of BTLA expressed on HIV-, CMV-, or influenza virus–specific CD8+ T cells in the different study groups. In panels B, C, E, and G, each dot represents 1 individual, and horizontal bars represent the median values. Multiple comparisons were made using the Kruskal-Wallis H nonparametric test among the different groups. The Mann-Whitney U test was used to compare data from 2 different groups. The significant P values are shown.
Figure 2.
Figure 2.
B and T lymphocyte attenuator (BTLA) down-regulation and human immunodeficiency virus (HIV)-1 disease progression. The correlation analysis is between BTLA expression on CD4+ T cells with CD4+ T-cell numbers (n = 71), HIV load (n = 71), and CD38 expression on CD8 T cells (n = 30; A) as well as the expression of Ki67 (n = 18), PD-1 expression (n = 30), and CD127 (n = 21; B) on CD4 T cells in HIV-1–infected patients. P values are shown. The Spearman rank correlation test was used to evaluate the correlations between variables.
Figure 3.
Figure 3.
B and T lymphocyte attenuator (BTLA) down-regulation in CD4+ T-cell subsets in human immunodeficiency virus (HIV)-1–infected individuals. A, Representative BTLA expressions on CD4+ T-cell subsets from a healthy subject and an HIV-1-infected individual. The percentages of each CD4+ T-cell population are shown in each quadrant (left panel). The BTLA percentages in each CD4+ T-cell population are shown as histograms (right panel). B, Statistical analysis of the BTLA expression levels in CD4+ T-cell subsets in the different study groups. *P < .05. Multiple comparisons were made using the Kruskal-Wallis H nonparametric test among the different groups. The Mann-Whitney U test was used to compare data from 2 different groups. Tn, naive T cells; Tcm, central memory T cells; Tem, effector memory T cells.
Figure 4.
Figure 4.
B and T lymphocyte attenuator (BTLA)–positive CD4+ T cells and abnormal immune status in human immunodeficiency virus (HIV)–1 infection. A, The analysis of percentages of BTLA+ and BTLA CD4+ T cells in naive T cell (Tn), central memory T cell (Tcm), and effector memory T-cell (Tem) subsets in healthy subjects and HIV-1–infected individuals. B, The phenotypic profiles of BTLA+ and BTLA CD4+ T cells analyzed for CD38, CD95, CD127, perforin, PD-1, and Ki67 expression in healthy subjects (n = 16) and HIV-1-infected subjects (8 long-term nonprogressors 10 typical progressors, and 9 patients with AIDS). *P <.05, **P <.01. Multiple comparisons were made using the Kruskal-Wallis H nonparametric test among the different groups. The Mann-Whitney U test was used to compare data from 2 different groups.
Figure 5.
Figure 5.
B and T lymphocyte attenuator (BTLA) down-regulation on CD4+ T cells is dependent on pDC-derived interferon (IFN)-α induced by human immunodeficiency virus (HIV)–1 exposure. A, Representative histograms indicating the effects of various cytokines on BTLA expression on CD4 T cells from healthy subjects in vitro. Values represent the BTLA percentages and mean fluorescence intensity (MFI) on CD4+ T cells. The data are representative of 3 independent experiments. B, Representative histograms indicating the effects of various HIV-1 isolates on BTLA expression by CD4+ T cells in vitro. Values represent the BTLA percentages and MFI on CD4+ T cells. The data are representative of 4 independent experiments. C, Representative histograms indicating that the CD4 interaction (B12 antibody), endocytosis (chloroquine), and IFN-α (anti-IFN-α/β) but not reverse-transcriptase inhibitor (nevirapine) are required for NL4-3-induced BTLA down-regulation. Values represent the percentages of CD4+ T cells that express BTLA. D, Pooled data confirming that NL4-3 isolates down-regulated BTLA expression (percentages and MFI) dependening on IFN-α in vitro. Error bars indicate standard deviations. *P < .05. E, Representative histograms indicating that NL4-3 exposure induces BTLA down-regulation on CD4+ T cells in vitro depending on plasmacytoid dendritic cell -derived IFN-α. Values represent the percentages and MFI of CD4+ T cells that express BTLA.
Figure 6.
Figure 6.
B and T lymphocyte attenuator (BTLA)–mediated inhibition on CD4+ T-cell activation during human immunodeficiency virus (HIV)–1 infection. A, Representative histograms depicting the expression of CD38, CD25, and CD69 in CD4+ T cells from a healthy subject. Values represent the percentage of CD4+ T cells that express CD38, CD25, and CD69. B, Pooled data showing the fold-inhibition of anti-BTLA cross-linking on anti-CD3-induced CD4+ T-cell activation in HIV-1–infected typical progressors/patients with AIDS (n = 26) and healthy subjects (n = 8). C, Representative dot plots show the effects of anti-BTLA cross-linking on interleukin (IL)-2 and interferon (IFN)–γ production of CD4+ T cells induced by anti-CD3 or PMA/ionomycin stimulation in a healthy subject. Values in the 3 quadrants represent the percentages of CD4+ T cells that express IFN-γ and IL-2. D, Pooled data showing the fold-inhibition of anti-BTLA cross-linking on IL-2 and IFN-γ production of CD4+ T cells induced by anti-CD3– and PMA/ionomycin–stimulation in HIV-infected typical progressors and patients with AIDS (n = 16) and healthy subjects (n = 8). In panels B and D, fold-inhibition was calculated as the differences between the baseline activation marker expression on isotype control antibody stimulation and anti-BTLA antibody stimulation were divided by the baseline activation marker expression on CD4+ T cells with isotype control antibody stimulation. The Mann-Whitney U test was used to compare data from 2 different groups. P values are shown.

Similar articles

Cited by

References

    1. Appay V, Sauce D. Immune activation and inflammation in HIV-1 infection: causes and consequences. J Pathol. 2008;214:231–241. - PubMed
    1. Hazenberg MD, Hamann D, Schuitemaker H, Miedema F. T cell depletion in HIV-1 infection: how CD4+ T cells go out of stock. Nat Immunol. 2000;1:285–289. - PubMed
    1. Giorgi JV, Hultin LE, McKeating JA, et al. Shorter survival in advanced human immunodeficiency virus type 1 infection is more closely associated with T lymphocyte activation than with plasma virus burden or virus chemokine coreceptor usage. J Infect Dis. 1999;179:859–870. - PubMed
    1. Deeks SG, Kitchen CM, Liu L, et al. Immune activation set point during early HIV infection predicts subsequent CD4+ T-cell changes independent of viral load. Blood. 2004;104:942–947. - PubMed
    1. Silvestri G, Sodora DL, Koup RA, et al. Nonpathogenic SIV infection of sooty mangabeys is characterized by limited bystander immunopathology despite chronic high-level viremia. Immunity. 2003;18:441–452. - PubMed

Publication types

MeSH terms