. 2011 Aug;85(15):7523-34.
doi: 10.1128/JVI.02697-10. Epub 2011 May 18.

Demographic processes affect HIV-1 evolution in primary infection before the onset of selective processes

Affiliations

Demographic processes affect HIV-1 evolution in primary infection before the onset of selective processes

Joshua T Herbeck et al. J Virol. 2011 Aug.

Abstract

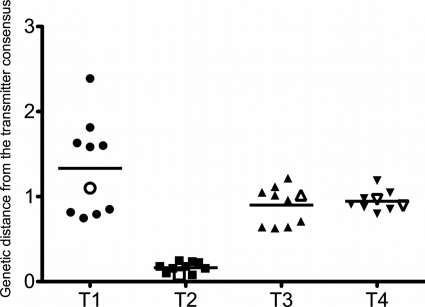
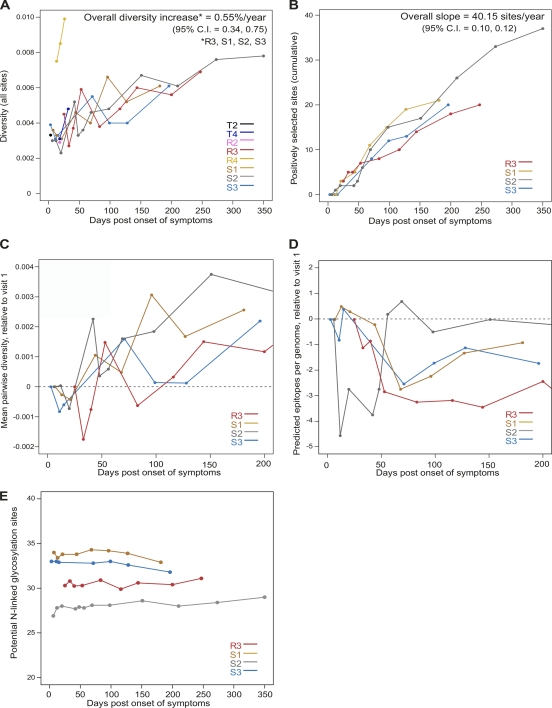
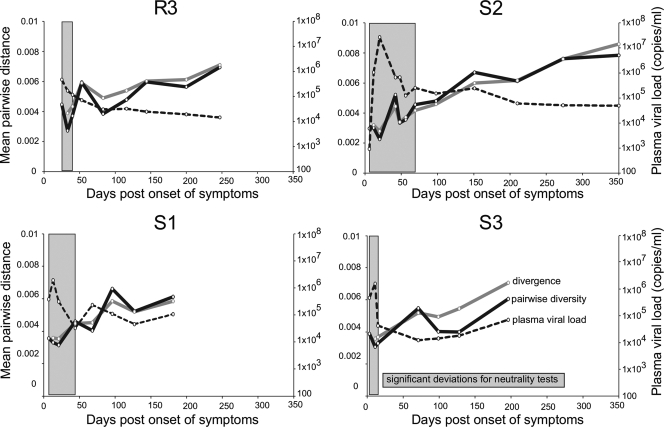
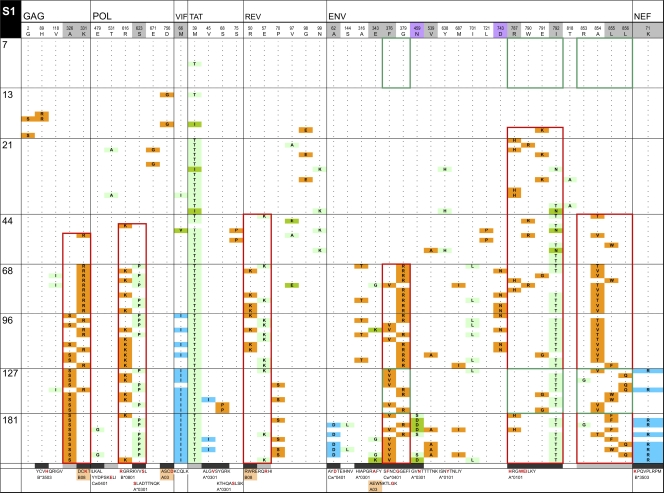
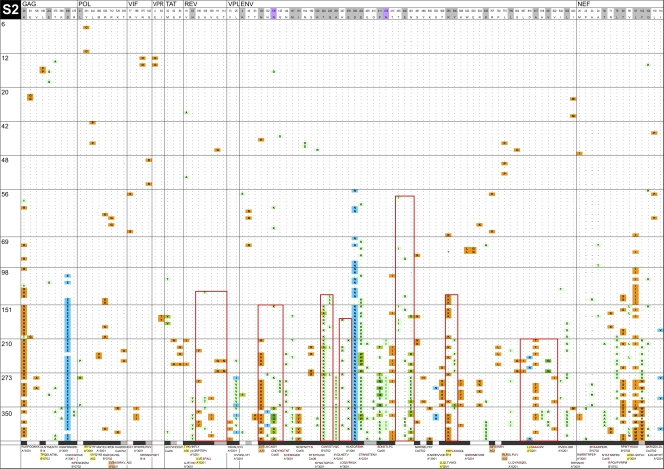
HIV-1 transmission and viral evolution in the first year of infection were studied in 11 individuals representing four transmitter-recipient pairs and three independent seroconverters. Nine of these individuals were enrolled during acute infection; all were men who have sex with men (MSM) infected with HIV-1 subtype B. A total of 475 nearly full-length HIV-1 genome sequences were generated, representing on average 10 genomes per specimen at 2 to 12 visits over the first year of infection. Single founding variants with nearly homogeneous viral populations were detected in eight of the nine individuals who were enrolled during acute HIV-1 infection. Restriction to a single founder variant was not due to a lack of diversity in the transmitter as homogeneous populations were found in recipients from transmitters with chronic infection. Mutational patterns indicative of rapid viral population growth dominated during the first 5 weeks of infection and included a slight contraction of viral genetic diversity over the first 20 to 40 days. Subsequently, selection dominated, most markedly in env and nef. Mutants were detected in the first week and became consensus as early as day 21 after the onset of symptoms of primary HIV infection. We found multiple indications of cytotoxic T lymphocyte (CTL) escape mutations while reversions appeared limited. Putative escape mutations were often rapidly replaced with mutually exclusive mutations nearby, indicating the existence of a maturational escape process, possibly in adaptation to viral fitness constraints or to immune responses against new variants. We showed that establishment of HIV-1 infection is likely due to a biological mechanism that restricts transmission rather than to early adaptive evolution during acute infection. Furthermore, the diversity of HIV strains coupled with complex and individual-specific patterns of CTL escape did not reveal shared sequence characteristics of acute infection that could be harnessed for vaccine design.


Figures

Fig. 1.
Fig. 1.
Phylogenetic trees of HIV-1 genome sequences. The large (left side, unboxed) tree contains nine individuals and is based on 9 to 15 full genome sequences from each sampled time point (up to 12 time points extending up to 350 days after the onset of symptoms). The boxed tree (lower right) contains four transmitter-recipient pairs (T1-R1, T2-R2, T3-R3, and T4-R4) and is based on genome sequences from the recipient's first sampled time point during acute infection (and from the transmitter near the time of transmission). Pair T1-R1 is not included in the larger tree because sequencing at later time points primarily involved subgenomic fragments. Both trees were generated using the maximum-likelihood method with the general time reversible-gamma distribution model employed in PhyML (version 2.4.5). The scale bar represents the number of substitutions per site.
Fig. 2.
Fig. 2.
The recipient founder virus is typical of the viral population in the transmitter. Distribution of genetic distances between the 10 transmitter sequences obtained near the time of transmission and the corresponding consensus sequence in the transmitter is shown. The line represents the mean genetic distance for each transmitter. The transmitter sequence that was the closest (had the lowest pairwise genetic distance) to any recipient sequence at visit 1 is represented as an open symbol. For pair T4-R4, two variants established infection in the recipient, so the transmitter sequence closest to each variant is shown. T2 was acutely infected at the time of transmission to R2.
Fig. 3.
Fig. 3.
Trends in genetic diversity, positive selection, potential N-linked glycosylation, and epitope number. (A) Mean pairwise nucleotide diversity across genomes (corrected with the Hasegawa-Kishino-Yano [HKY] substitution model). (B) Cumulative number of amino acid sites under positive selection as identified by FEL or the simulation method of Liu et al. (41). Only positively selected sites at which two or more mutations occur at the same time point were counted (in order to better identify the beginning of selective events). (C) Mean pairwise nucleotide diversity across genomes; values for each time point are reported relative to those found in the first sampled time point (visit 1). (D) Mean number of epitopes predicted by the Epipred algorithm over the first 200 days after symptoms; as in panel C, values for each time point are relative to the first sampled time point. The dashed lines cross zero. (E) Potential N-linked glycosylation sites.
Fig. 4.
Fig. 4.
Stochastic processes predominate during acute HIV-1 infection. Plots for four individuals followed from 3 up to 350 days postonset of symptoms. Trends in pairwise diversity and divergence from the first visit consensus for genome nucleotide alignments are shown along with plasma viral RNA load over the same period (the legend is shown in the S3 panel). Times during which significant negative deviations for Tajima's D and Fu and Li's D* neutrality tests were detected are shown in shaded blocks.
Fig. 5.
Fig. 5.
InSites diagrams of genomes from longitudinal samples. The figure shows the alignment of phylogenetically informative sites identified in genome sequences relative to the visit 1 consensus sequence in the recipient. Genome sequences from different time points are separated by horizontal lines; days postonset of symptoms are displayed on the left of each row. The header row includes the visit 1 consensus sequence with HXB2 numbering, shaded in gray for positively selected sites (as detected by FEL or by a simulation approach [41, 53]) and in purple for putative N-linked glycosylation sites. The bottom row shows known or potential epitopes predicted by NetMHC (unshaded), by Epipred (shaded in coral), or by both methods (in yellow). Amino acid sites within epitopes are shaded in black; amino acid sites located near known or predicted epitopes (up to 5 aa away) are shaded in gray. Green boxes surround HIV-1 segments recognized by IFN-γ ELISPOT responses. Red boxes surround mutually exclusive mutation patterns. Orange cells represent forward mutations (decrease in database frequency of the amino acid by 50% or more), blue cells represent reverse mutations (increase in database frequency of the amino acid by 50% or more), and green cells represent less substantial changes in database frequency.
Fig. 5.
Fig. 5.
InSites diagrams of genomes from longitudinal samples. The figure shows the alignment of phylogenetically informative sites identified in genome sequences relative to the visit 1 consensus sequence in the recipient. Genome sequences from different time points are separated by horizontal lines; days postonset of symptoms are displayed on the left of each row. The header row includes the visit 1 consensus sequence with HXB2 numbering, shaded in gray for positively selected sites (as detected by FEL or by a simulation approach [41, 53]) and in purple for putative N-linked glycosylation sites. The bottom row shows known or potential epitopes predicted by NetMHC (unshaded), by Epipred (shaded in coral), or by both methods (in yellow). Amino acid sites within epitopes are shaded in black; amino acid sites located near known or predicted epitopes (up to 5 aa away) are shaded in gray. Green boxes surround HIV-1 segments recognized by IFN-γ ELISPOT responses. Red boxes surround mutually exclusive mutation patterns. Orange cells represent forward mutations (decrease in database frequency of the amino acid by 50% or more), blue cells represent reverse mutations (increase in database frequency of the amino acid by 50% or more), and green cells represent less substantial changes in database frequency.

References

    1. Abrahams M. R., et al. 2009. Quantitating the multiplicity of infection with human immunodeficiency virus type 1 subtype C reveals a non-Poisson distribution of transmitted variants. J. Virol. 83:3556–3567 - PMC - PubMed
    1. Allen T. M., et al. 2005. Selective escape from CD8+ T-cell responses represents a major driving force of human immunodeficiency virus type 1 (HIV-1) sequence diversity and reveals constraints on HIV-1 evolution. J. Virol. 79:13239–13249 - PMC - PubMed
    1. Anderson J. A., et al. 2010. HIV-1 populations in semen arise through multiple mechanisms. PLoS Pathog. 6:e1001053. - PMC - PubMed
    1. Bar K. J., et al. 2010. Wide variation in the multiplicity of HIV-1 infection among injection drug users. J. Virol. 84:6241–6247 - PMC - PubMed
    1. Bhattacharya T., et al. 2007. Founder effects in the assessment of HIV polymorphisms and HLA allele associations. Science 315:1583–1586 - PubMed

Publication types

LinkOut - more resources