Comparative Study
. 2011 May 18;31(20):7249-58.
doi: 10.1523/JNEUROSCI.0095-11.2011.

Myelination and axonal electrical activity modulate the distribution and motility of mitochondria at CNS nodes of Ranvier

Affiliations
Comparative Study

Myelination and axonal electrical activity modulate the distribution and motility of mitochondria at CNS nodes of Ranvier

Nobuhiko Ohno et al. J Neurosci. .

Abstract

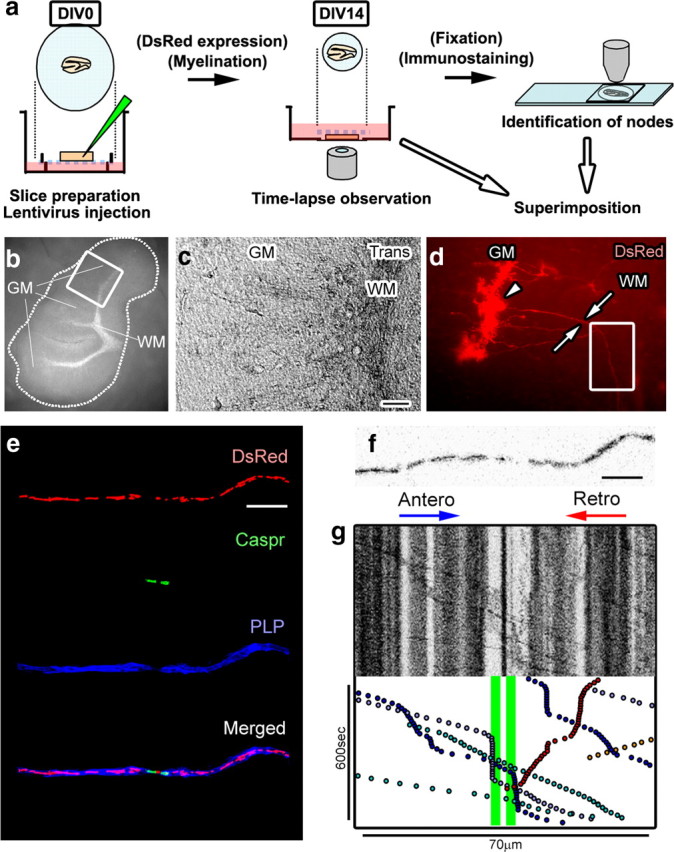
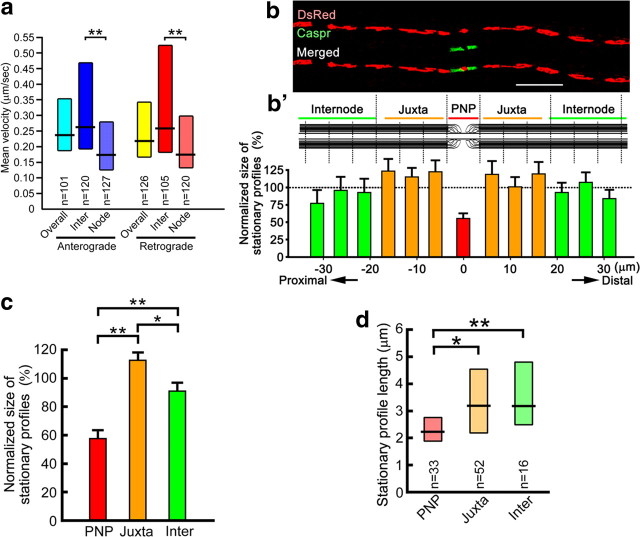
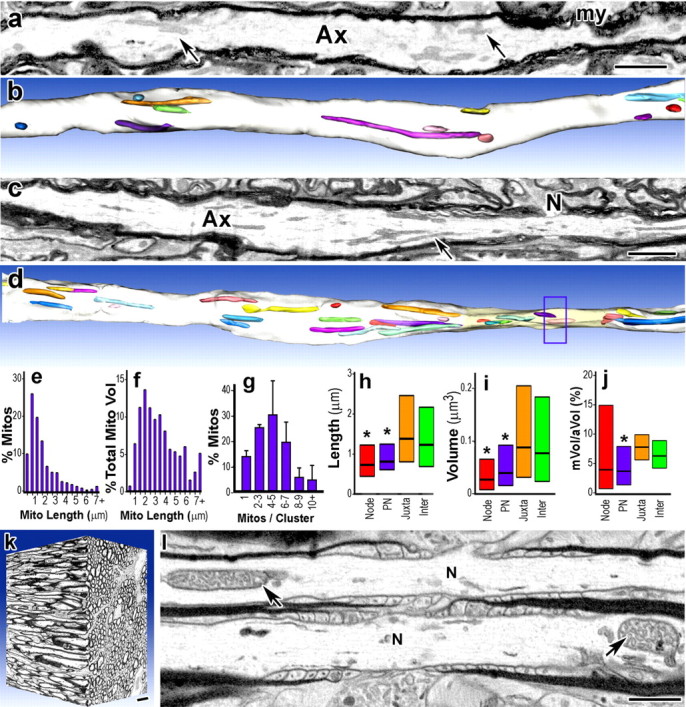
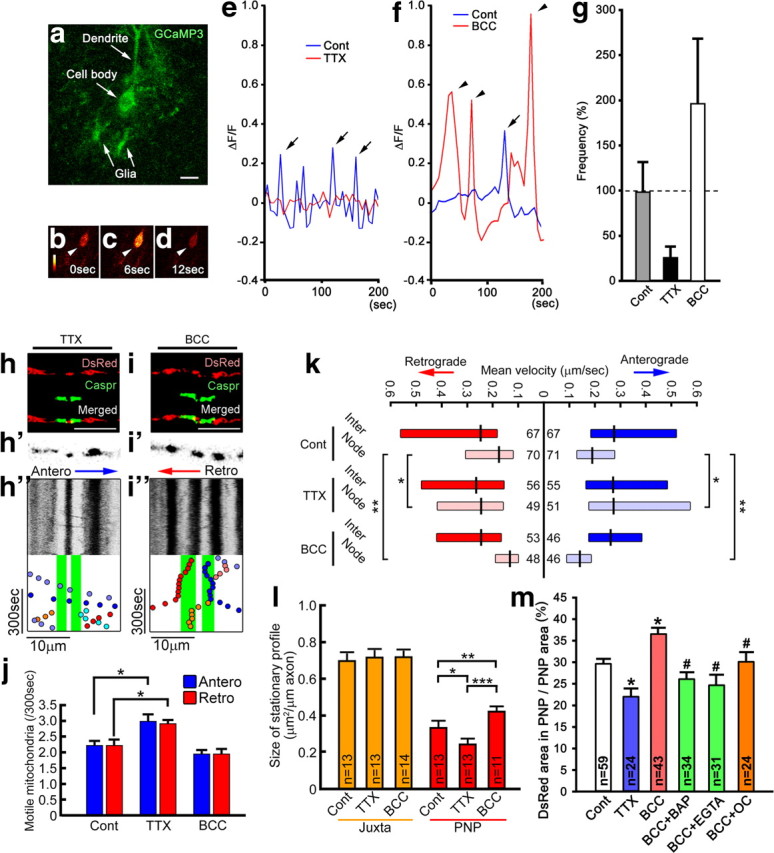
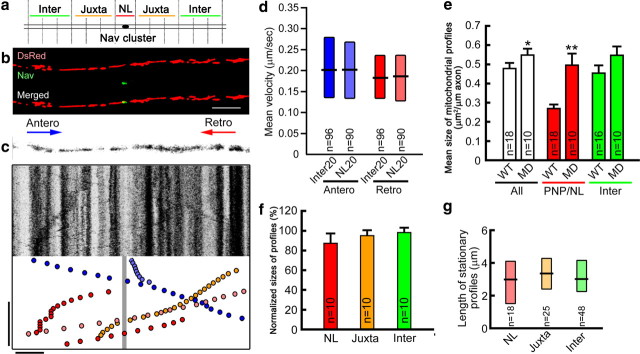
Energy production presents a formidable challenge to axons as their mitochondria are synthesized and degraded in neuronal cell bodies. To meet the energy demands of nerve conduction, small mitochondria are transported to and enriched at mitochondrial stationary sites located throughout the axon. In this study, we investigated whether size and motility of mitochondria in small myelinated CNS axons are differentially regulated at nodes, and whether mitochondrial distribution and motility are modulated by axonal electrical activity. The size/volume of mitochondrial stationary sites was significantly larger in juxtaparanodal/internodal axoplasm than in nodal/paranodal axoplasm. With three-dimensional electron microscopy, we observed that axonal mitochondrial stationary sites were composed of multiple mitochondria of varying length, except at nodes where mitochondria were uniformly short and frequently absent altogether. Mitochondrial transport speed was significantly reduced in nodal axoplasm compared with internodal axoplasm. Increased axonal electrical activity decreased mitochondrial transport and increased the size of mitochondrial stationary sites in nodal/paranodal axoplasm. Decreased axonal electrical activity had the opposite effect. In cerebellar axons of the myelin-deficient rat, which contain voltage-gated Na(+) channel clusters but lack paranodal specializations, axonal mitochondrial motility and stationary site size were similar at Na(+) channel clusters and other axonal regions. These results demonstrate juxtaparanodal/internodal enrichment of stationary mitochondria and neuronal activity-dependent dynamic modulation of mitochondrial distribution and transport in nodal axoplasm. In addition, the modulation of mitochondrial distribution and motility requires oligodendrocyte-axon interactions at paranodal specializations.


Figures

Figure 1.
Figure 1.
Time-lapse imaging of axonal mitochondria in cerebellar slice cultures. a, Schematic summary of experimental approach. b, c, P10 cerebellar slices are myelinated by 14DIV with microscopically apparent white matter (WM) and gray matter (GM). d, Purkinje cell soma are transfected with Mito-DsRed (arrowhead) and project DsRed-positive myelinated axons (arrows) into white matter. e, Time-lapse images of DsRed-labeled axonal mitochondria were obtained (d, box) and superimposed on images of the same axon immunostained for the paranodal protein Caspr and the compact myelin protein PLP. f, g, A single frame from the time-lapse imaging (f) and a kymographic summary (g) of stationary (vertical black lines) and motile (diagonal lines) mitochondria within different regions of this myelinated axon. Paranodal loops are colored green in the kymograph (g). Scale bars: c, 50 μm; e, f, 10 μm. Antero, anterograde; Retro, retrograde.
Figure 2.
Figure 2.
Mitochondrial transport velocity and mitochondrial stationary site sizes are decreased in nodal axoplasm. a, Mean anterograde and retrograde mitochondrial transport velocities are significantly decreased in nodal (±10 μm from nodes) compared with internodal (20-∼40 μm from nodes) axoplasm (**p < 0.001). b, b′, Mitochondrial stationary site size and length were measured at different axonal sites defined by length of and distance from Caspr staining. c, d, The normalized size (c) and length (d) of mitochondrial stationary sites were significantly smaller in nodal–paranodal axoplasm (PNP) than in juxtaparanodal (Juxta) or internodal (Inter) axoplasm and mitochondrial stationary site size was greater in juxtaparanodal compared with internodal axoplasm (c). *p < 0.02, **p < 0.008. n shows number of mitochondria in a and d. n = 12-∼15 axons in b and c. b′, c, Bars, Mean + SEM. a, d, Boxes, Median with first and third quartiles. Scale bar, 10 μm.
Figure 3.
Figure 3.
Mitochondria are not enriched in nodal axoplasm and stationary sites usually contain multiple mitochondria. a–l, The three-dimensional distribution of axonal mitochondrial was determined by serial-section electron microscopy of rat cerebellar white matter (ai) and mouse optic nerve (jl). a–d, Single sections (a, c) and 3D reconstructions of internodal (b) and nodal (d) regions of cerebellar myelinated axons (Ax). A node (c, N) is marked in the 3D reconstruction (d, box). e, f, Axonal mitochondrial lengths vary from <1 μm to >7 μm (e). Axonal mitochondria longer than 4 μm represent <10% of the total axonal mitochondria (e), but >25% of the total axonal mitochondrial volume (f). g, Internodal mitochondria (a, c, arrows; b, d, colored areas) frequently overlap and 86% are present in clusters of 2–11 mitochondria (Mito). h, i, Mitochondria in nodal and paranodal (PN) axoplasm are shorter (h) and smaller (i) than mitochondria in juxtaparanodal (Juxta) and internodal (Inter) axoplasm. j, The ratio of mitochondrial volume to axonal volume (mVol/aVol, expressed as a percentage) was highly variable in nodal axoplasm, and many nodes (39%) lacked mitochondria. k, Mitochondria in mouse optic nerve axons were distributed similarly to those in myelinated cerebellar axons. l, Internodal mitochondria (arrows) were abundant and 67% of nodes lacked mitochondria. g, Bars, Mean + SEM. h–j, Boxes, Median with first and third quartiles. *p < 0.001 Mann–Whitney U tests. a, c, Images montaged from serial slices. Scale bars, 1 μm.
Figure 4.
Figure 4.
Electrical activity and Ca2+ increase the size of mitochondrial stationary sites and decrease mitochondrial motility in nodal axoplasm. Mitochondrial transport speed and distribution were investigated following TTX and BCC treatment. a–g, In a Purkinje cell body expressing GCaMP3 (a), increase (b to c, arrowheads) and return (c to d, arrowheads) of fluorescent intensity show a Ca2+ transient. The frequency (and amplitude) of Ca2+ transients are decreased threefold by TTX (e) and increased twofold (f) by BCC (g). h–j, Kymographs of nodal axoplasm after TTX (h–h″) and BCC (i–i″) show the number of motile mitochondria is increased by TTX and unchanged by BCC (j). *p < 0.01; n = 18 axons for each group. k, The speed of mitochondrial transport was significantly increased by TTX and significantly decreased by BCC in nodal axoplasm but not in internodal axoplasm. *p = 0.03, **p < 0.001; n, number of mitochondria marked on each bar. l, TTX decreased and BCC increased mitochondrial stationary site size in nodal axoplasm, but not in juxtaparanodal axoplasm. *p = 0.02, **p = 0.01, ***p < 0.001. m, TTX also decreased and BCC increased the percentage nodal axoplasm area occupied by mitochondria. Ca2+ chelaters [EGTA, BAPTA-AM (BAP)] or a Ca2+ channel blocker [ω-conotoxin MVIIC (OC)] eliminated the increase of nodal mitochondria size by BCC. #p < 0.05 compared with BCC alone, *p < 0.001; n = number of fibers (l) or nodes (m) examined. g, j, l, m, Bars, Mean + SEM. k, Boxes, Median with first and third quartiles. Cont, control; PNP, nodal–paranodal; Inter, internodal; Juxta, juxtaparanodal; Antero, anterograde; Retro, retrograde.
Figure 5.
Figure 5.
Oligodendrocyte–axon interactions affect distribution and transport of axonal mitochondria. a–c, The distribution and transport rates of axonal mitochondria were compared in slice cultures of wild-type (WT) and myelin-deficient (MD) rats; myelin-deficient axons have Na+ channel clusters, but lack paranodal loops and compact myelin. Vertical bar, 300 s; horizontal bar, 10 μm. d, In contrast to wild-type myelinated axons, mean mitochondrial transport speed was identical in internodal and nodal-like axoplasm of myelin-deficient fibers. e–g, The mean size (e), normalized size (f), and length (g) of axonal mitochondria were similar in node-like (NL) and internodal axoplasm of myelin-deficient fibers. Mean mitochondria size in nodal-like and all axoplasm were significantly larger than mean mitochondrial size in wild-type axons. *p = 0.05, **p < 0.001; n, number of mitochondria (d, g) or axons (e, f). e, f, Bars, Mean + SEM. d, g, Boxes, Median with first and third quartiles. PNP, nodal–paranodal; Inter, internodal; Juxta, juxtaparanodal; Antero, anterograde; Retro, retrograde.

References

    1. Alix JJ, Dolphin AC, Fern R. Vesicular apparatus, including functional calcium channels, are present in developing rodent optic nerve axons and are required for normal node of Ranvier formation. J Physiol. 2008;586:4069–4089. - PMC - PubMed
    1. Arroyo EJ, Xu T, Grinspan J, Lambert S, Levinson SR, Brophy PJ, Peles E, Scherer SS. Genetic dysmyelination alters the molecular architecture of the nodal region. J Neurosci. 2002;22:1726–1737. - PMC - PubMed
    1. Berthold CH, Fabricius C, Rydmark M, Andersén B. Axoplasmic organelles at nodes of Ranvier. I. Occurrence and distribution in large myelinated spinal root axons of the adult cat. J Neurocytol. 1993;22:925–940. - PubMed
    1. Bhat MA. Molecular organization of axo-glial junctions. Curr Opin Neurobiol. 2003;13:552–559. - PubMed
    1. Birgbauer E, Rao TS, Webb M. Lysolecithin induces demyelination in vitro in a cerebellar slice culture system. J Neurosci Res. 2004;78:157–166. - PubMed

Publication types

MeSH terms