Comparative Study
. 2011 May 18;31(20):7412-23.
doi: 10.1523/JNEUROSCI.0191-11.2011.

Dopamine-galanin receptor heteromers modulate cholinergic neurotransmission in the rat ventral hippocampus

Affiliations
Comparative Study

Dopamine-galanin receptor heteromers modulate cholinergic neurotransmission in the rat ventral hippocampus

Estefanía Moreno et al. J Neurosci. .

Abstract

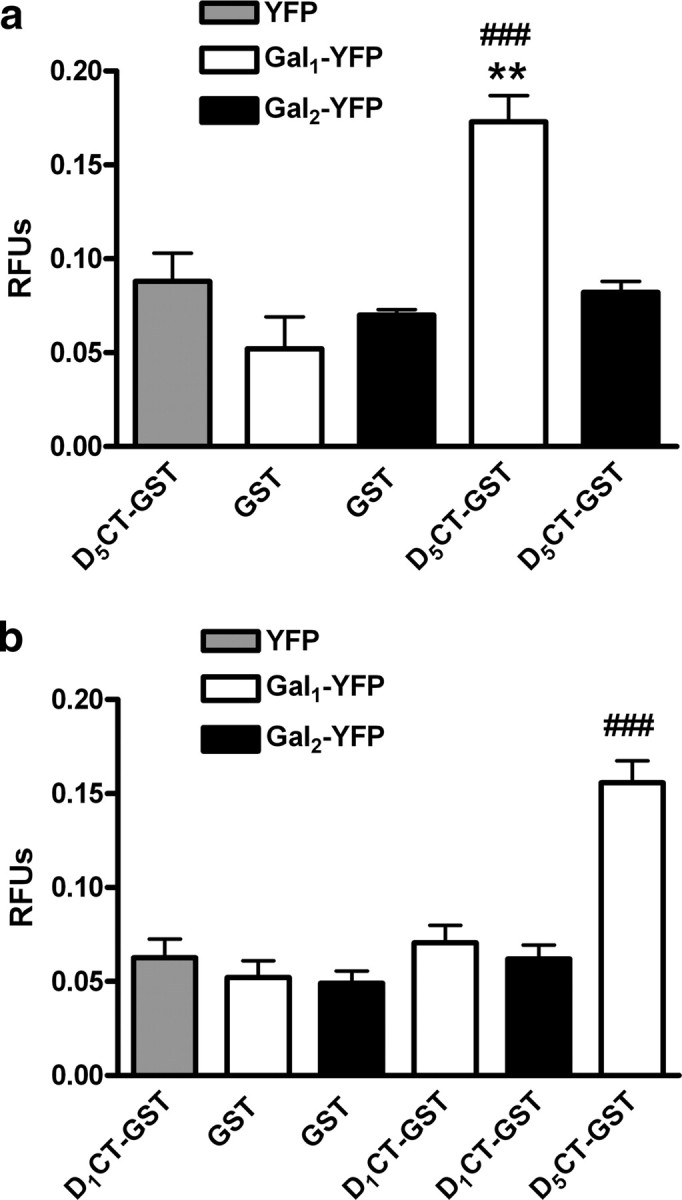
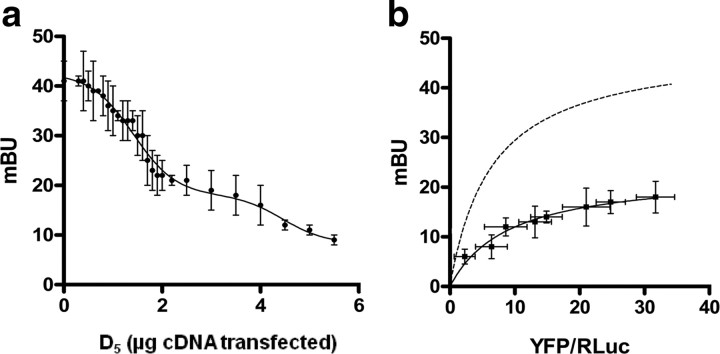
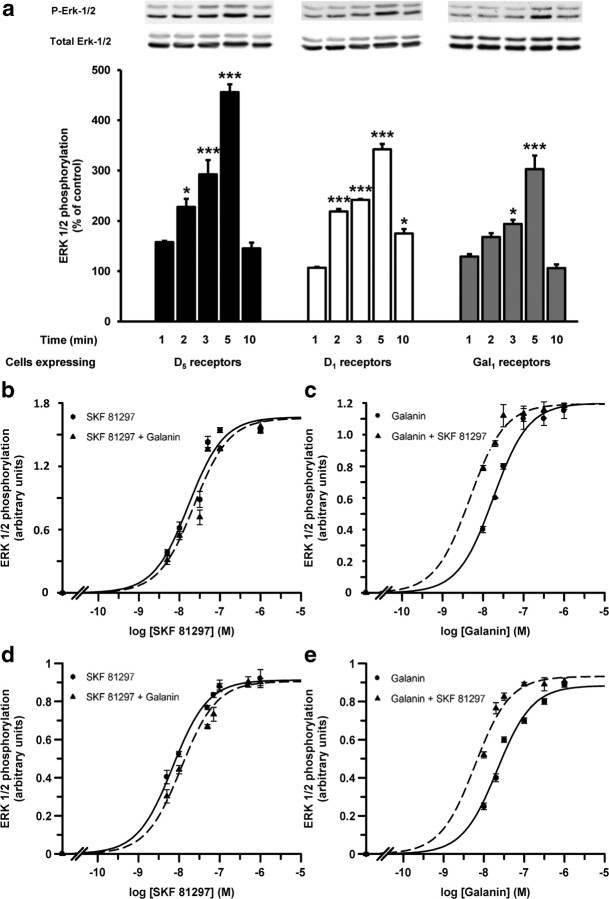
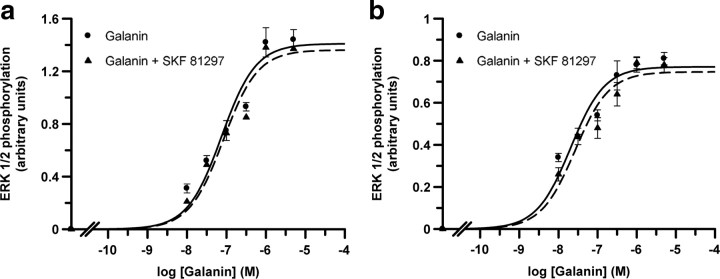
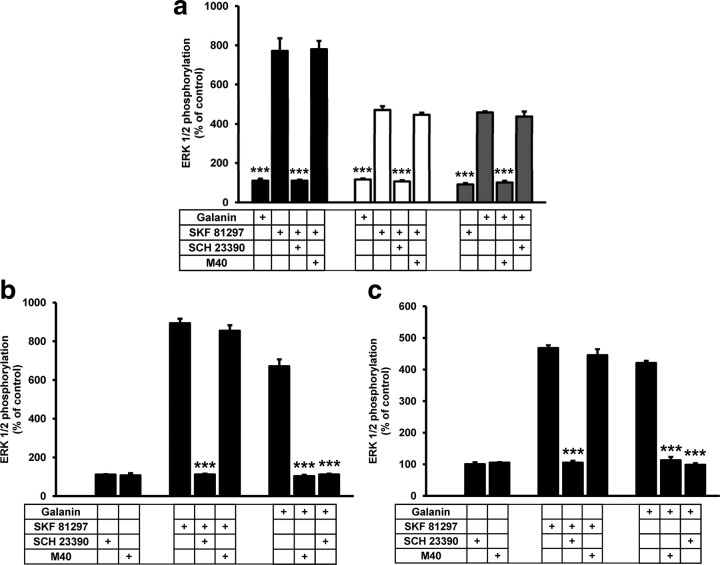
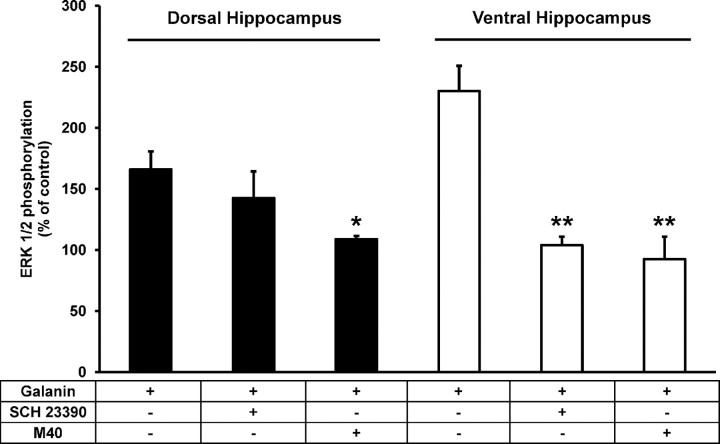
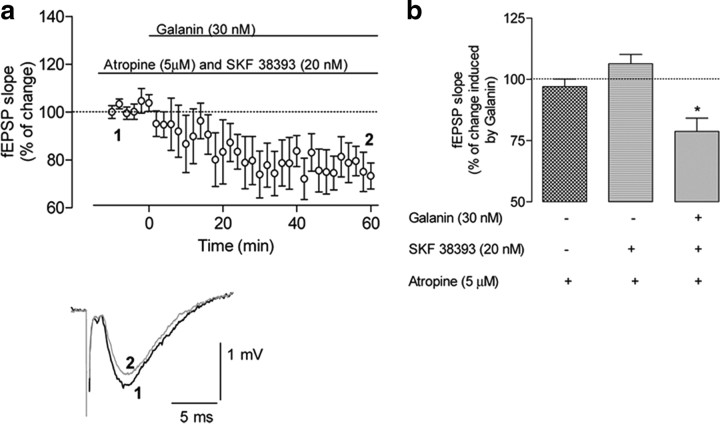
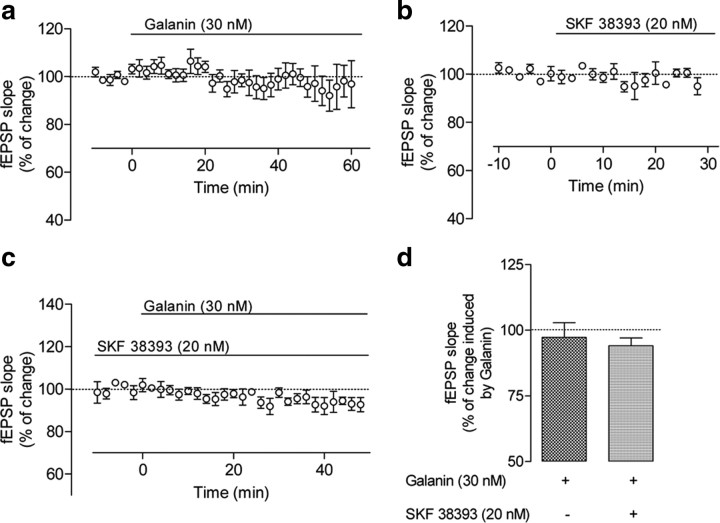
Previous studies have shown that dopamine and galanin modulate cholinergic transmission in the hippocampus, but little is known about the mechanisms involved and their possible interactions. By using resonance energy transfer techniques in transfected mammalian cells, we demonstrated the existence of heteromers between the dopamine D(1)-like receptors (D(1) and D(5)) and galanin Gal(1), but not Gal(2) receptors. Within the D(1)-Gal(1) and D(5)-Gal(1) receptor heteromers, dopamine receptor activation potentiated and dopamine receptor blockade counteracted MAPK activation induced by stimulation of Gal(1) receptors, whereas Gal(1) receptor activation or blockade did not modify D(1)-like receptor-mediated MAPK activation. Ability of a D(1)-like receptor antagonist to block galanin-induced MAPK activation (cross-antagonism) was used as a "biochemical fingerprint" of D(1)-like-Gal(1) receptor heteromers, allowing their identification in the rat ventral hippocampus. The functional role of D(1)-like-Gal receptor heteromers was demonstrated in synaptosomes from rat ventral hippocampus, where galanin facilitated acetylcholine release, but only with costimulation of D(1)-like receptors. Electrophysiological experiments in rat ventral hippocampal slices showed that these receptor interactions modulate hippocampal synaptic transmission. Thus, a D(1)-like receptor agonist that was ineffective when administered alone turned an inhibitory effect of galanin into an excitatory effect, an interaction that required cholinergic neurotransmission. Altogether, our results strongly suggest that D(1)-like-Gal(1) receptor heteromers act as processors that integrate signals of two different neurotransmitters, dopamine and galanin, to modulate hippocampal cholinergic neurotransmission.


Figures

Figure 1.
Figure 1.
D1–Gal1 and D5–Gal1 receptor heteromers in living cells. a, Confocal microscopy images of cells expressing (top to bottom) D5-Rluc (0.6 μg plasmid) and Gal1-YFP (1 μg plasmid), Gal2-Rluc (0.5 μg plasmid) and D5-YFP receptors (1 μg plasmid), D1-Rluc (0.5 μg plasmid) and Gal1-YFP (1 μg plasmid), and Gal2-Rluc (0.5 μg plasmid) and D1-YFP (1.3 μg plasmid) receptors. Proteins were identified by fluorescence or by immunocytochemistry. D5-Rluc, D1-Rluc, or Gal2-Rluc receptor immunoreactivity is shown in red; Gal1-YFP, D5-YFP, or D1-YFP receptor fluorescence in shown in green; and colocalization is shown in yellow. Scale bars, 5 μm. b, BRET experiments were performed with cells coexpressing D5-Rluc (400 ng plasmid; red) or D1-Rluc (300 ng plasmid; blue) and Gal1-YFP receptors (0.4 to 7 μg plasmid), Gal2-Rluc (300 ng plasmid) and D5-YFP receptors (0.5 to 5 μg plasmid; green) or D1-YFP receptors (0.5 to 4 μg plasmid; purple), or, as negative controls, D5-Rluc (600 ng plasmid; gray) or D1-Rluc (500 ng plasmid; orange) and CB1-YFP receptors (0.5 to 7 μg plasmid) or 5HT2B-Rluc (1 μg plasmid) and Gal1-YFP receptors (0.5 to 5 μg plasmid) (black). Both fluorescence and luminescence of each sample were measured before every experiment to confirm similar donor expressions (about 150,000 luminescent units) while monitoring the increase acceptor expression (10,000–70,000 fluorescent units). The relative amount of BRET is given as the ratio between the fluorescence of the acceptor minus the fluorescence detected in cells expressing only the donor and the luciferase activity of the donor. BRET data are expressed as the mean ± SD of 4–16 different experiments grouped as a function of the amount of BRET acceptor. At the top, a scheme corresponding to a BRET assay is shown.
Figure 2.
Figure 2.
Role of the C-terminal domains of D1 and D5 receptors in heteromerization with Gal1 receptor. a, b, Extracts from cells transfected with either Gal1-YFP or Gal2-YFP receptors or just with YFP (see Materials and Methods) were incubated with GST-D5CT or with just GST (a) or GST-D1CT, GST-D5CT, or with just GST (b). The results of pull-down experiments (see Materials and Methods) were analyzed by measuring fluorescence. Results are expressed as the mean ± SEM (3 independent experiments with 3 replicates) of relative fluorescence units (RFUs); **p < 0.01 (significantly different compared to the pull down of YFP with GST-D5CT); ###p < 0.001 (significantly different compared to the pull down of Gal1-YFP with GST; repeated-measures ANOVA with Bonferroni's correction).
Figure 3.
Figure 3.
D1 and D5 receptors compete for binding to Gal1 receptors. a, b, BRET experiments were performed with cells coexpressing D1-Rluc (300 ng plasmid) and Gal1-YFP receptors (4 μg plasmid) and increasing amounts of D5 receptors (0 to 5.5 μg plasmid) (a) or D1-Rluc (300 ng plasmid), Gal1-YFP (0.3 to 5 μg plasmid), and D5 receptors (1.5 μg plasmid) (b). In a, no significant variation in luminescence caused by D1-Rluc receptors (about 150,000 luminescent units) or fluorescence caused by Gal1-YFP receptors (about 10,000–70,000 fluorescent units) was observed by increasing D5 receptor expression. In b, similar luminescence attributable to D1-Rluc or fluorescence attributable to Gal1-YFP receptors was obtained in the absence or presence of D5 receptors. The relative amount of BRET is given as the ratio between the fluorescence of the acceptor minus the fluorescence detected in cells expressing only the donor and the luciferase activity of the donor. BRET data are expressed as the mean ± SD of 4–16 different experiments grouped as a function of the amount of BRET acceptor. The dashed curve represents BRET saturation curve obtained with the D1-Rluc receptor and increasing amounts of cDNA for the Gal1-YFP receptor in the absence of D5 receptors shown in Figure 1.
Figure 4.
Figure 4.
Cross talk between D1-like receptors and Gal1 receptors on ERK1/2 phosphorylation in transfected cells. a, Cells transfected with the cDNA corresponding to D5 (1.5 μg, black), D1 (1.2 μg, white), or Gal1 (2 μg, gray) receptors were stimulated for the indicated times with 50 nm (black) or 70 nm (white) of the D1-like receptor agonist SKF 81297 or with 100 nm galanin (gray). ERK1/2 phosphorylation was determined as indicated in Materials and Methods. The immunoreactive bands from three to five experiments were quantified and the values represent the mean ± SEM of the percentage of phosphorylation relative to the basal levels found in untreated cells; *p < 0.05; ***p < 0.001 (significantly different compared to the results obtained after 1 min of agonist exposure; one-way ANOVA with Bonferroni's correction). b–e, Cells cotransfected with the cDNA corresponding to D5 (1.3 μg) and Gal1 (1.8 μg) receptors (b, c) or D1 (1 μg) and Gal1 (1.8 μg) receptors (d, e) were treated for 5 min with the indicated concentrations of the D1-like receptor agonist SKF 81297 in the absence (circles) or in the presence (triangles) of 100 nm galanin (b, d) or with the indicated concentrations of galanin in absence (circles) or presence (triangles) of 50 nm (c) or 70 nm SKF 81297 (d). The immunoreactive bands from four independent experiments were quantified and the values represent the mean ± SEM of phosphorylation (arbitrary units) minus the basal levels found in SKF 81297- (b, d) or galanin-untreated (c, e) cells.
Figure 5.
Figure 5.
Lack of cross talk between D1-like receptors and Gal2 receptors on ERK1/2 phosphorylation in transfected cells. a, b, Cells were cotransfected with the cDNA corresponding to D5 (1.5 μg) and Gal2 (2 μg) receptors (a) or to D1 (1 μg) and Gal2 (2 μg) receptors (b). Cells were treated for 5 min with the indicated concentrations of galanin in the absence (circles) or in the presence (triangles) of 50 nm (a) or 70 nm (b) of SKF 81297. The immunoreactive bands from four independent experiments were quantified and the values represent the mean ± SEM of phosphorylation (arbitrary units) minus the basal levels found in untreated cells.
Figure 6.
Figure 6.
D1-like receptor antagonist-mediated blockade of galanin-induced ERK1/2 phosphorylation in cells expressing D1-like and Gal1 receptors. a, Cells were transfected with the cDNA corresponding to D5 (1.5 μg, black), D1 (1.2 μg, white) or Gal1 receptors (2 μg, gray) and were stimulated with the D1-like receptor agonist SKF 81297 (70 nm) or with galanin (100 nm) in the presence or absence of the D1-like receptor antagonist SCH 23390 (10 μm) or the Gal1 receptor antagonist M40 (10 μm); ***p < 0.001 [significantly different compared to the effect of SKF 81297 alone (black and white columns) or to the effect of galanin alone (gray columns); one-way ANOVA with Bonferroni's correction]. b, c, Cells cotransfected with the cDNA corresponding to D5 (1.3 μg) and Gal1 receptors (1.8 μg) (b) or to D1 (1 μg) and Gal1 (1.8 μg) receptors (c) were treated with SCH 23390 (10 μm), M40 (10 μm), SKF 81297 (70 nm), or galanin (100 nm) alone or in combination; ***p < 0.001 [significantly different compared to the effect of SKF 81297 alone (in cells treated with SKF 81297) or to the effect of galanin alone (in cells treated with galanin); one-way ANOVA with Bonferroni's correction]. In all cases, cells were treated for 5 min with the indicated concentrations of agonists and 20 min before the addition of agonists with the indicated concentrations of antagonists. The inmunoreactive bands from four to five experiments were quantified, and the values represent the mean ± SEM of the percentage of phosphorylation relative to the basal levels found in untreated cells (100%).
Figure 7.
Figure 7.
D1-like receptor antagonist-mediated blockade of galanin-induced ERK1/2 phosphorylation in rat hippocampal slices. Slices from dorsal (black) or ventral (white) hippocampus were treated for 10 min with medium, SCH 23390 (10 μm), or M40 (10 μm) before the addition of galanin (300 nm) and an additional incubation period of 10 min. The inmunoreactive bands from four slices from two different animals were quantified and the values represent the mean ± SEM of the percentage of phosphorylation relative to the basal levels found in untreated slices (100%). *p < 0.05; **p < 0.01 (significantly different compared to the effect of galanin alone; one-way ANOVA with Bonferroni's correction).
Figure 8.
Figure 8.
Effect of a D1-like receptor agonist and galanin on K+-induced [3H]ACh release from ventral hippocampal synaptosomes. a, Dopamine receptors were activated (right column) by preincubation with the agonist SKF 38393 before addition of galanin. b, Galanin receptors were activated (right column) by preincubation with galanin before addition of SKF 38393. Ordinates represent the S2/S1 ratios as percentage of the control value in the same experiments (see Materials and Methods). Drug conditions during S1 and S2 are indicated below each bar. In the ordinates, 100% represents the S2/S1 ratio in the absence of the test drug, i.e., in the absence of galanin (a) or in the absence of SKF 38393 (b), using the same synaptosomal batch. An S2/S1 ratio close to 100% represents, therefore, absence of effect of the test drug (galanin in a or SKF 38393 in b). Values are mean ± SEM (n = 3–6). In a, 100% corresponds to 0.76 ± 0.046, and in b it corresponds to 0.70 ± 0.029. The presence of SKF 38393 (a) or of galanin (b) during S1 and S2 did not significantly affect S2/S1 ratios compared with those obtained in the absence of any drug. *p < 0.05; NS, p > 0.05 (Student's t test).
Figure 9.
Figure 9.
Effect of coactivation of D1-like and galanin receptors on galanin-mediated modulation of synaptic transmission in the ventral hippocampus. a, Schematic representation of a transverse hippocampal slice with the electrode configuration used to record fEPSPs in the CA1 apical dendritic layer (stratum radiatum) evoked by electric stimulation (S0) of the Schaffer fibers. b, Averaged time courses of changes in fEPSP slope induced by application of 30 nm galanin alone. c, Averaged time course of changes in fEPSP slope induced by application of 20 nm SKF 38393 alone. d, Averaged time courses of the effect of galanin (30 nm) in the presence of the D1-like receptor agonist SKF 38393 (20 nm; ●) or in the presence of both SKF 38393 (10 nm) and the D1-like receptor antagonist SCH23390 (1 μm; ○). SKF 38393 was applied at least 30 min before galanin application, and SCH 23390 was applied 30 min before SKF 38393 application. e, Recordings obtained from representative experiments, where each trace is the average of eight consecutive responses obtained in absence (1) and presence (2) of galanin (30 nm; left), in absence (3) and presence (4) of SKF 38393 (20 nm; middle), and in absence (5) and presence (6) of galanin (30 nm) when the slice was incubated with SKF 38393 (20 nm; right) are shown D1-like; each trace is composed of the stimulus artifact followed by the presynaptic volley and the fEPSP. Superimposed recordings were obtained from the same slice at the time points indicated in b–d. Note the inhibitory effect of galanin in b (absence of SKF 38393) and facilitatory effect in d (presence of SKF 38393). f, Comparison between the averaged effects of galanin on hippocampal synaptic transmission in presence of SKF 38393 and in the presence of both SKF 38393 and SCH 23390. The ordinates show the percent change of fEPSP slope induced by galanin (30 nm) 50–60 min after its application to hippocampal slices not treated or treated with SKF 38393 and treated with both SKF 38393 and SCH 23390, as indicated below each bar. θ, p < 0.05 (one-way ANOVA with Bonferroni's correction) as compared with absence of galanin in the same slices; ϕ, p < 0.05 (one-way ANOVA with the Bonferroni's correction) as compared with galanin alone. All values are mean ± SEM [100%, averaged fEPSP slopes at times −10 to 0: d, −0.69 ± 0.073 mV/ms, n = 8 (●); −0.66 ± 0.103 mV/ms, n = 6 (○); b, −0.69 ± 0.023 mV/ms, n = 9; c, −0.64 ± 0.041 mV/ms, n = 7].
Figure 10.
Figure 10.
Effect of muscarinic receptor blockade on the dopamine-dependent galanin-mediated modulation of synaptic transmission in the ventral hippocampus. a, Top, Averaged time courses of the effect of galanin (30 nm) in the presence of both the D1-like receptor agonist SKF 38393 (20 nm) and the muscarinic acetylcholine receptor antagonist atropine (5 μm). SKF 38393 was applied at least 60 min before galanin, and atropine was applied 30 min before SKF 38393. Bottom, Traces obtained with a representative experiment; each trace is the average of eight consecutive responses obtained immediately before (1) and during (2) galanin application, and is composed of the stimulus artifact followed by the presynaptic volley and the fEPSP. b, Comparison between the averaged effects of galanin (30 nm for 50–60 min) in the absence of drugs and in the presence of both SKF 38393 and atropine. The averaged effects of atropine and both atropine and SKF 38393 are also shown; θ, p < 0.05 (Student's t test) compared with absence of galanin in the same slices; ϕ, p < 0.05 (Student's t test) compared with both atropine and SKF 38393 present in the same slices. All values are shown as the mean ± SEM (100%, averaged fEPSP slopes at times −10–0: a, −0.60 ± 0.037 mV/ms; n = 6).
Figure 11.
Figure 11.
Lack of effect of galanin on synaptic transmission in the dorsal hippocampus. a, b, Averaged time course of changes in fEPSP slope induced by application of 30 nm galanin (a) or 20 mm SKF 38393 (b). c, Averaged time courses of the effect of galanin (30 nm) in the presence of the D1-like receptor agonist SKF 38393 (20 nm). SKF 38393 was applied at least 30 min before galanin; ordinates show the percent change of fEPSP slope induced by galanin (30 nm) 50–60 min after its application to hippocampal slices not treated and treated with SKF 38393, as indicated below each bar. All values are shown as the mean ± SEM (100%, averaged fEPSP slopes at times −10–0: a, −0.55 ± 0.070 mV/ms, n = 5; b, −0.58 ± 0.048 mV/ms, n = 3; c, −0.55 ± 0.064 mV/ms, n = 3). d, Comparison between the averaged effects of galanin in the presence and absence of SKF 38393.

References

    1. Acquas E, Fibiger HC. Dopaminergic regulation of striatal acetylcholine release: the critical role of acetylcholinesterase inhibition. J Neurochem. 1998;70:1088–1093. - PubMed
    1. Anderson WW, Collingridge GL. The LTP Program: a data acquisition program for on-line analysis of long-term potentiation and other synaptic events. J Neurosci Methods. 2001;108:71–83. - PubMed
    1. Branchek TA, Smith KE, Gerald C, Walker MW. Galanin receptor subtypes. Trends Pharmacol Sci. 2000;21:109–117. - PubMed
    1. Bulenger S, Marullo S, Bouvier M. Emerging role of homo- and heterodimerization in G-protein-coupled receptor biosynthesis and maturation. Trends Pharmacol Sci. 2005;26:131–137. - PubMed
    1. Carriba P, Ortiz O, Patkar K, Justinova Z, Stroik J, Themann A, Müller C, Woods AS, Hope BT, Ciruela F, Casadó V, Canela EI, Lluis C, Goldberg SR, Moratalla R, Franco R, Ferré S. Striatal adenosine A2A and cannabinoid CB1 receptors form functional heteromeric complexes that mediate the motor effects of cannabinoids. Neuropsychopharmacology. 2007;32:2249–2259. - PubMed

Publication types

MeSH terms