

CT scans in young people in Northern England: trends and patterns 1993-2002
- PMID: 21594548
- PMCID: PMC3992619
- DOI: 10.1007/s00247-011-2110-7
CT scans in young people in Northern England: trends and patterns 1993-2002
Abstract
Background: Although CT can be greatly beneficial, its relatively high radiation doses have caused public health concerns.
Objective: To assess patterns in CT usage among patients aged less than 22 years in Northern England during the period 1993-2002.
Materials and methods: Electronic data were obtained from radiology information systems of all nine National Health Service trusts in the region.
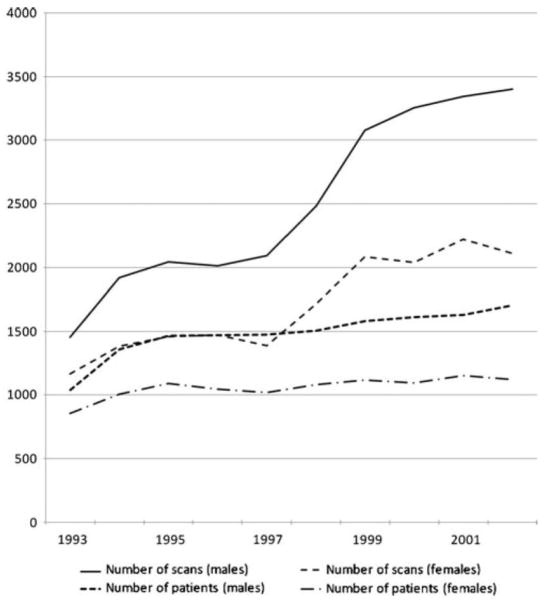
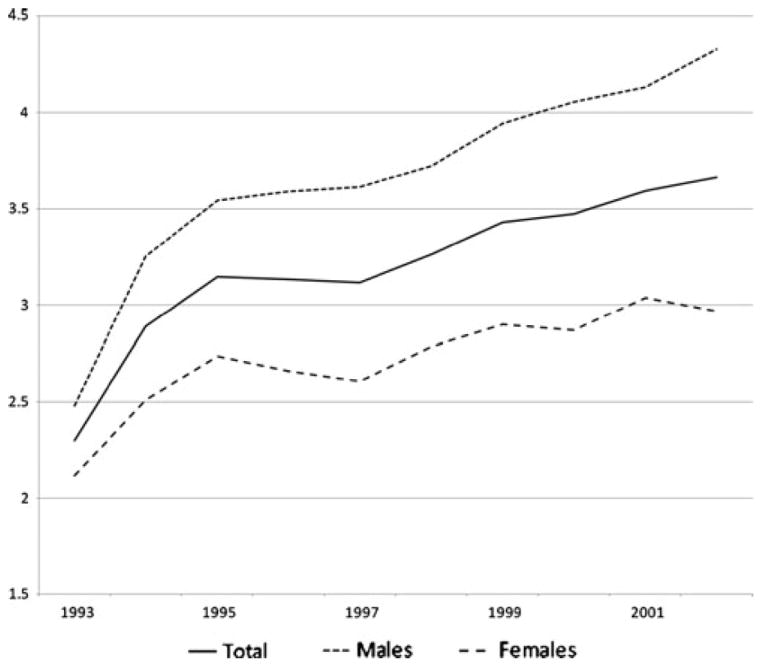
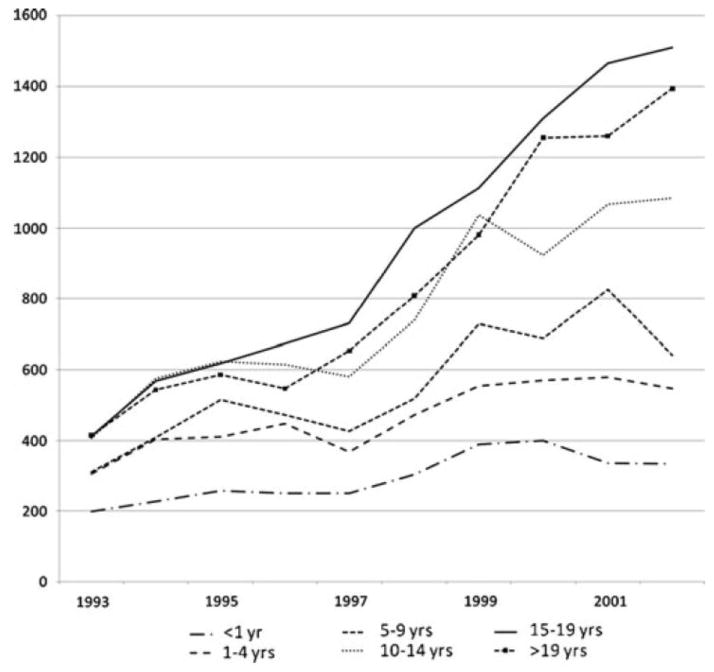
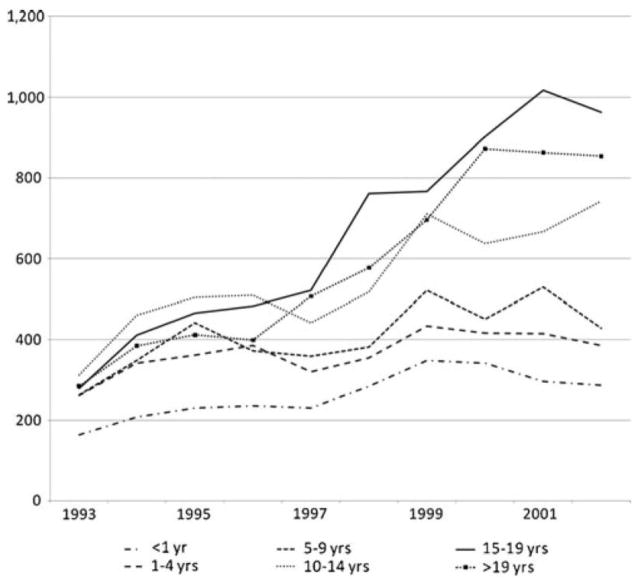
Results: A total of 38,681 scans had been performed in 20,483 patients aged less than 22 years. The number of CT examinations rose, with the steepest increase between 1997 and 2000. The number of patients scanned per year increased less dramatically, with 2.24/1,000 population aged less than 22 years having one scan or more in 1993 compared to 3.54/1,000 in 2002. This reflects an increase in the median number of scans per patient, which rose from 1 in 1993 to 2 by 1999. More than 70% of CT examinations were of the head, with the number of head examinations varying with time and patient age.
Conclusion: The frequency of CT scans in this population more than doubled during the study period. This is partly, but not wholly, explained by an increase in the number of scans per patient.
Figures
Comment in
-
New knowledge about CT usage and dose optimisation in children, but a major question is still unanswered.Pediatr Radiol. 2011 Jul;41(7):801-2. doi: 10.1007/s00247-011-2129-9. Epub 2011 May 19. Pediatr Radiol. 2011. PMID: 21594542 No abstract available.
References
-
- Hart D, Wall BF. UK population dose from medical X-ray examinations. Eur J Radiol. 2004;50:285–291. - PubMed
-
- Department of Health. [Accessed May 2011];Hospital Activity Statistics. 2008 Available from: http://www.performance.doh.gov.uk/hospitalactivity/data_requests/imaging....
-
- Brenner DJ, Elliston CD, Hall EJ, et al. Estimated risks of radiation-induced fatal cancer from paediatric CT. AJR. 2001;176:289–296. - PubMed
-
- Parker L. Computed tomography scanning in children: radiation risks. Pediatr Hematol Oncol. 2001;18:307–308. - PubMed
Publication types
MeSH terms
Grants and funding
LinkOut - more resources
Full Text Sources
Medical
