

Detecting rare and common variants for complex traits: sibpair and odds ratio weighted sum statistics (SPWSS, ORWSS)
- PMID: 21594893
- PMCID: PMC3114642
- DOI: 10.1002/gepi.20588
Detecting rare and common variants for complex traits: sibpair and odds ratio weighted sum statistics (SPWSS, ORWSS)
Abstract
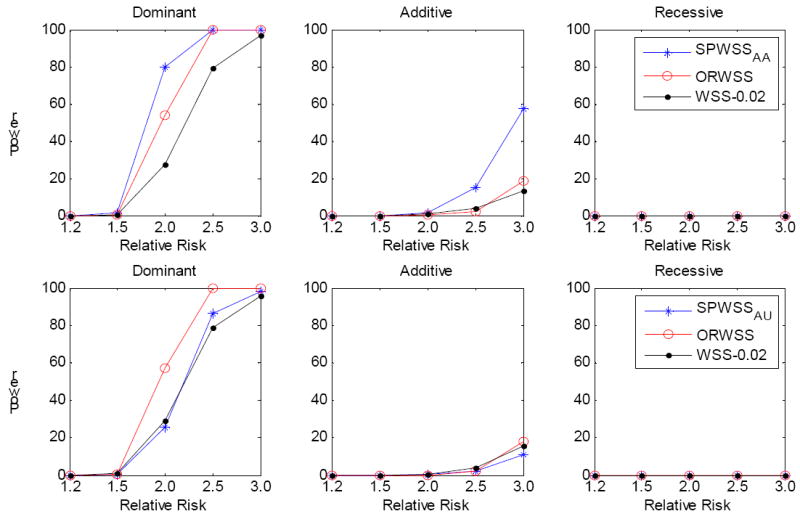
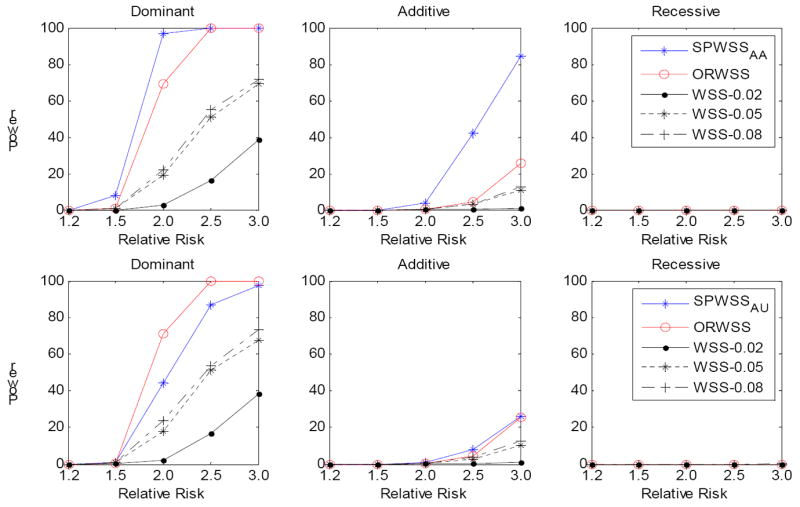
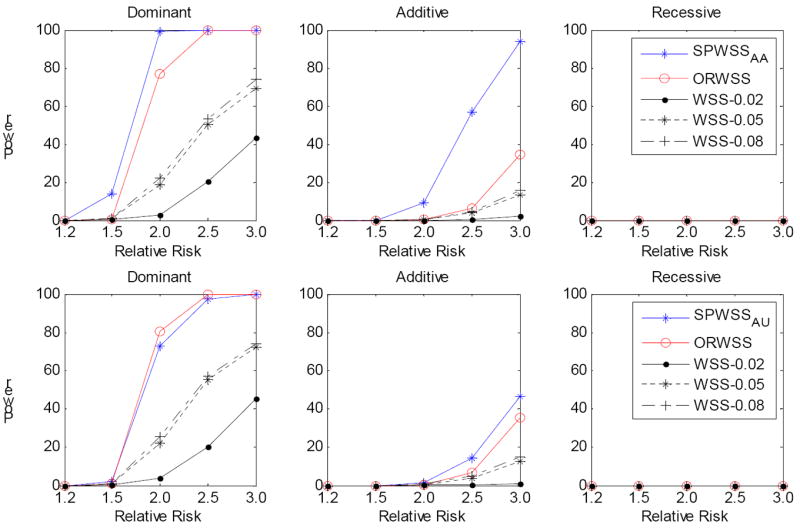
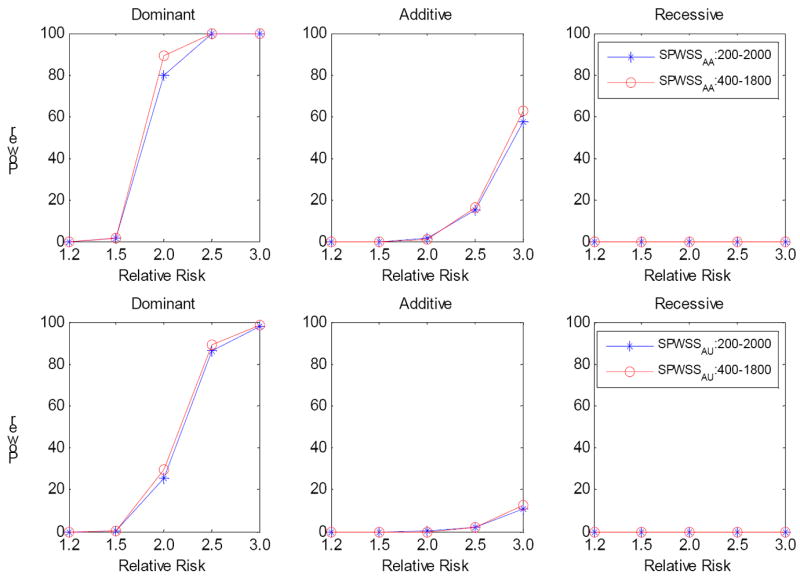
It is generally known that risk variants segregate together with a disease within families, but this information has not been used in the existing statistical methods for detecting rare variants. Here we introduce two weighted sum statistics that can apply to either genome-wide association data or resequencing data for identifying rare disease variants: weights calculated based on sibpairs and odd ratios, respectively. We evaluated the two methods via extensive simulations under different disease models. We compared the proposed methods with the weighted sum statistic (WSS) proposed by Madsen and Browning, keeping the same genotyping or resequencing cost. Our methods clearly demonstrate more statistical power than the WSS. In addition, we found that using sibpair information can increase power over using only unrelated samples by more than 40%. We applied our methods to the Framingham Heart Study (FHS) and Wellcome Trust Case Control Consortium (WTCCC) hypertension datasets. Although we did not identify any genes as reaching a genome-wide significance level, we found variants in the candidate gene angiotensinogen significantly associated with hypertension at P = 6.9 × 10(-4), whereas the most significant single SNP association evidence is P = 0.063. We further applied the odds ratio weighted method to the IFIH1 gene for type-1 diabetes in the WTCCC data. Our method yielded a P-value of 4.82 × 10(-4), much more significant than that obtained by haplotype-based methods. We demonstrated that family data are extremely informative in searching for rare variants underlying complex traits, and the odds ratio weighted sum statistic is more efficient than currently existing methods.
© 2011 Wiley-Liss, Inc.
Figures
Similar articles
-
Genome-wide searching of rare genetic variants in WTCCC data.Hum Genet. 2010 Sep;128(3):269-80. doi: 10.1007/s00439-010-0849-9. Epub 2010 Jun 13. Hum Genet. 2010. PMID: 20549515 Free PMC article.
-
Detecting rare variants for complex traits using family and unrelated data.Genet Epidemiol. 2010 Feb;34(2):171-87. doi: 10.1002/gepi.20449. Genet Epidemiol. 2010. PMID: 19847924 Free PMC article.
-
Rare variants of IFIH1, a gene implicated in antiviral responses, protect against type 1 diabetes.Science. 2009 Apr 17;324(5925):387-9. doi: 10.1126/science.1167728. Epub 2009 Mar 5. Science. 2009. PMID: 19264985 Free PMC article.
-
Cumulative effect of IFIH1 variants and increased gene expression associated with type 1 diabetes.Diabetes Res Clin Pract. 2015 Feb;107(2):259-66. doi: 10.1016/j.diabres.2014.11.008. Epub 2014 Dec 4. Diabetes Res Clin Pract. 2015. PMID: 25515714
-
Effects of type 1 diabetes-associated IFIH1 polymorphisms on MDA5 function and expression.Curr Diab Rep. 2015 Nov;15(11):96. doi: 10.1007/s11892-015-0656-8. Curr Diab Rep. 2015. PMID: 26385483 Review.
Cited by
-
A robust GWSS method to simultaneously detect rare and common variants for complex disease.PLoS One. 2015 Apr 16;10(4):e0120873. doi: 10.1371/journal.pone.0120873. eCollection 2015. PLoS One. 2015. PMID: 25880329 Free PMC article.
-
GEE-based SNP set association test for continuous and discrete traits in family-based association studies.Genet Epidemiol. 2013 Dec;37(8):778-86. doi: 10.1002/gepi.21763. Epub 2013 Oct 25. Genet Epidemiol. 2013. PMID: 24166731 Free PMC article.
-
Excalibur: A new ensemble method based on an optimal combination of aggregation tests for rare-variant association testing for sequencing data.PLoS Comput Biol. 2023 Sep 14;19(9):e1011488. doi: 10.1371/journal.pcbi.1011488. eCollection 2023 Sep. PLoS Comput Biol. 2023. PMID: 37708232 Free PMC article.
-
A general approach for combining diverse rare variant association tests provides improved robustness across a wider range of genetic architectures.Eur J Hum Genet. 2016 May;24(5):767-73. doi: 10.1038/ejhg.2015.194. Epub 2015 Oct 28. Eur J Hum Genet. 2016. PMID: 26508571 Free PMC article.
-
Weighted pedigree-based statistics for testing the association of rare variants.BMC Genomics. 2012 Nov 24;13:667. doi: 10.1186/1471-2164-13-667. BMC Genomics. 2012. PMID: 23176082 Free PMC article.
References
-
- Agresti A. Categorical data analysis. New York: Wiley-Interscience; 2002.
Publication types
MeSH terms
Substances
Grants and funding
LinkOut - more resources
Full Text Sources
Research Materials
