. 2011 May 19:11:131.
doi: 10.1186/1471-2148-11-131.

The mode and tempo of hepatitis C virus evolution within and among hosts

Affiliations

The mode and tempo of hepatitis C virus evolution within and among hosts

Rebecca R Gray et al. BMC Evol Biol. .

Abstract

Background: Hepatitis C virus (HCV) is a rapidly-evolving RNA virus that establishes chronic infections in humans. Despite the virus' public health importance and a wealth of sequence data, basic aspects of HCV molecular evolution remain poorly understood. Here we investigate three sets of whole HCV genomes in order to directly compare the evolution of whole HCV genomes at different biological levels: within- and among-hosts. We use a powerful Bayesian inference framework that incorporates both among-lineage rate heterogeneity and phylogenetic uncertainty into estimates of evolutionary parameters.

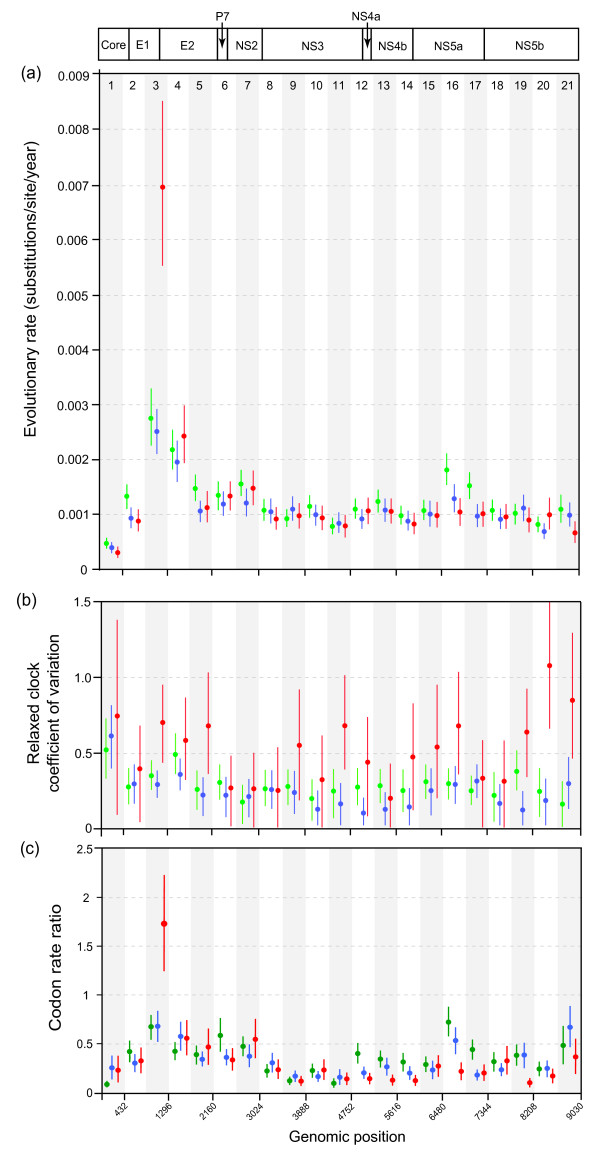
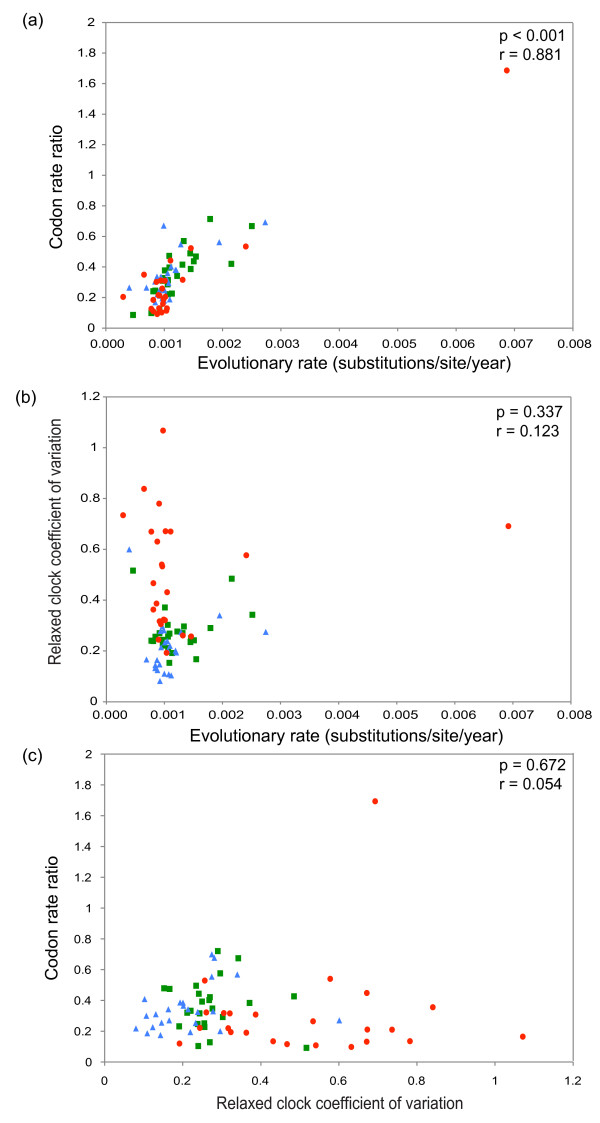
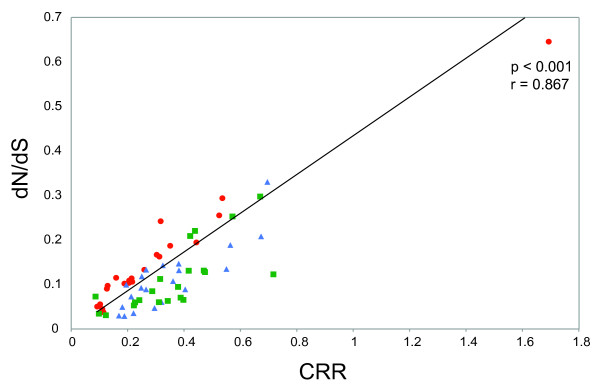
Results: Most of the HCV genome evolves at ~0.001 substitutions/site/year, a rate typical of RNA viruses. The antigenically-important E1/E2 genome region evolves particularly quickly, with correspondingly high rates of positive selection, as inferred using two related measures. Crucially, in this region an exceptionally higher rate was observed for within-host evolution compared to among-host evolution. Conversely, higher rates of evolution were seen among-hosts for functionally relevant parts of the NS5A gene. There was also evidence for slightly higher evolutionary rate for HCV subtype 1a compared to subtype 1b.

Conclusions: Using new statistical methods and comparable whole genome datasets we have quantified, for the first time, the variation in HCV evolutionary dynamics at different scales of organisation. This confirms that differences in molecular evolution between biological scales are not restricted to HIV and may represent a common feature of chronic RNA viral infection. We conclude that the elevated rate observed in the E1/E2 region during within-host evolution more likely results from the reversion of host-specific adaptations (resulting in slower long-term among-host evolution) than from the preferential transmission of slowly-evolving lineages.


Figures

Figure 1
Figure 1
The molecular clock behaviour of the HCV genome. Three separate data sets are shown: among host subtype 1a (green), among host subtype 1b (blue) and within-host (red). Separate parameters were estimated for each of 21 partitions spanning the HCV coding region (see genome schematic and partition numbering at top of Figure). The alternating white and grey bars are for visual clarity only; nucleotide numbering according to the H77 reference genome is show at the bottom. (a) Estimated mean evolutionary rates. For each partition and data set, the vertical bar represents the range of the 95% HPD credible region and the circle represents the point estimate of the mean rate. (b) Estimated coefficient of variation (COV) parameters for each partition and data set, which represent the among-lineage rate heterogeneity. The vertical bars represent the range of the HPD credible region and the circle shows the estimated COV value. (c) Estimated codon rate ratio (CRR) values, which represent the ratio of the evolution rate at codon positions 1 and 2 to that at codon position 3. As before, the vertical bar represents the range of the 95% HPD credible region and the circle represents the point estimate of CRR.
Figure 2
Figure 2
Scatterplots of the three molecular clock parameter estimates obtained for each partition, calculated using the uncorrelated lognormal (UCLN) relaxed clock model. Colouring is the same as that in Figure 1: among host subtype 1a data set (green squares), among host subtype 1b data set (blue triangles) and within-host data set (red circles). (a) Plot of mean evolutionary rate versus the coefficient of variation. (b) Plot of mean evolutionary rate versus the codon rate ration. (c) Plot of the coefficient of variation versus the codon rate ration. See main text for full description of each parameter. For each plot, the correlation coefficient (r) and statistical significance (p) of the relationships are given.
Figure 3
Figure 3
Scatterplot of the codon rate ratio estimate for each partition, versus the average dn/ds ratio, calculated using PAML. Colouring is the same as that in Figure 1: among host subtype 1a data set (green squares), among host subtype 1b data set (blue triangles) and within-host data set (red circles).

References

    1. Pybus OG, Rambaut A. Evolutionary analysis of the dynamics of viral infectious disease. Nature Reviews Genetics. 2009;10:540–550. - PMC - PubMed
    1. Grenfell BT, Pybus OG, Gog JR, Wood JL, Daly JM, Mumford JA, Holmes EC. Unifying the epidemiological and evolutionary dynamics of pathogens. Science. 2004;303:327–332. doi: 10.1126/science.1090727. - DOI - PubMed
    1. Levrero M. Viral hepatitis and liver cancer: the case of hepatitis C. Oncogene. 2006;25:3834–3847. doi: 10.1038/sj.onc.1209562. - DOI - PubMed
    1. Hepatitis-C FAQs for the Public. http://www.cdc.gov/hepatitis/C/cFAQ.htm#statistics
    1. Farci P, Shimoda A, Coiana A, Diaz G, Peddis G, Melpolder JC, Strazzera A, Chien DY, Munoz SJ, Balestrieri A, Purcell RH, Alter HJ. The outcome of acute hepatitis C predicted by the evolution of the viral quasispecies. Science. 2000;288:339–344. doi: 10.1126/science.288.5464.339. - DOI - PubMed

Publication types