. 2011 May 19:8:53.
doi: 10.1186/1742-2094-8-53.

Changes in interleukin-1 signal modulators induced by 3,4-methylenedioxymethamphetamine (MDMA): regulation by CB2 receptors and implications for neurotoxicity

Affiliations

Changes in interleukin-1 signal modulators induced by 3,4-methylenedioxymethamphetamine (MDMA): regulation by CB2 receptors and implications for neurotoxicity

Elisa Torres et al. J Neuroinflammation. .

Abstract

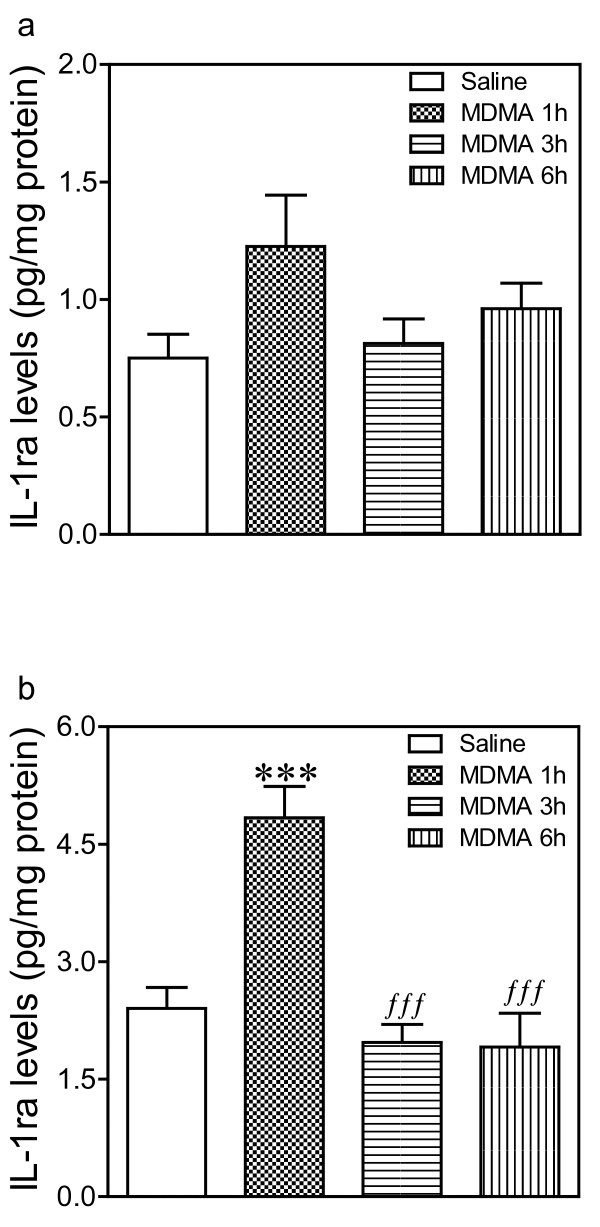
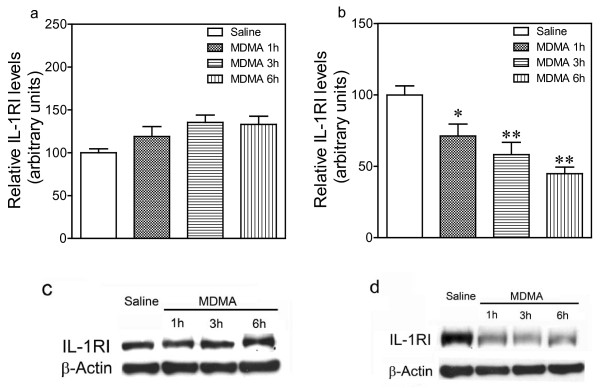
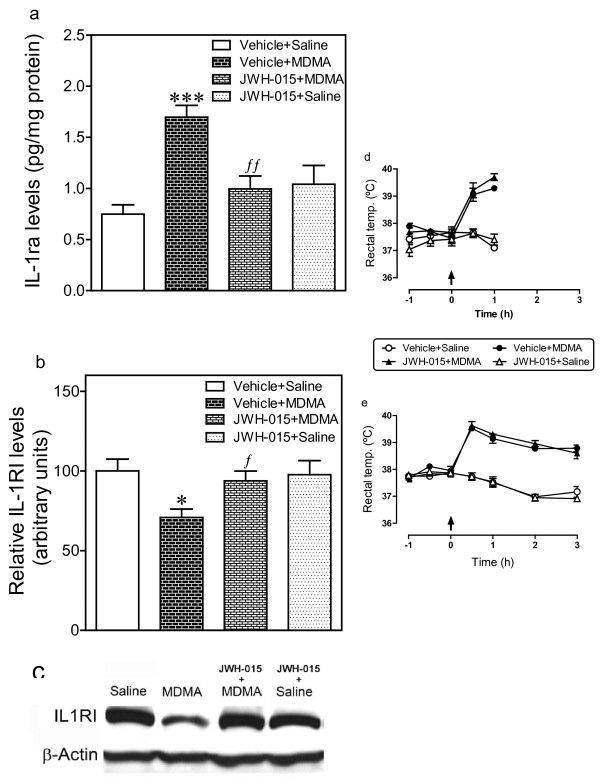
Background: 3,4-Methylenedioxymethamphetamine (MDMA) produces a neuroinflammatory reaction in rat brain characterized by an increase in interleukin-1 beta (IL-1β) and microglial activation. The CB2 receptor agonist JWH-015 reduces both these changes and partially protects against MDMA-induced neurotoxicity. We have examined MDMA-induced changes in IL-1 receptor antagonist (IL-1ra) levels and IL-1 receptor type I (IL-1RI) expression and the effects of JWH-015. The cellular location of IL-1β and IL-1RI was also examined. MDMA-treated animals were given the soluble form of IL-1RI (sIL-1RI) and neurotoxic effects examined.

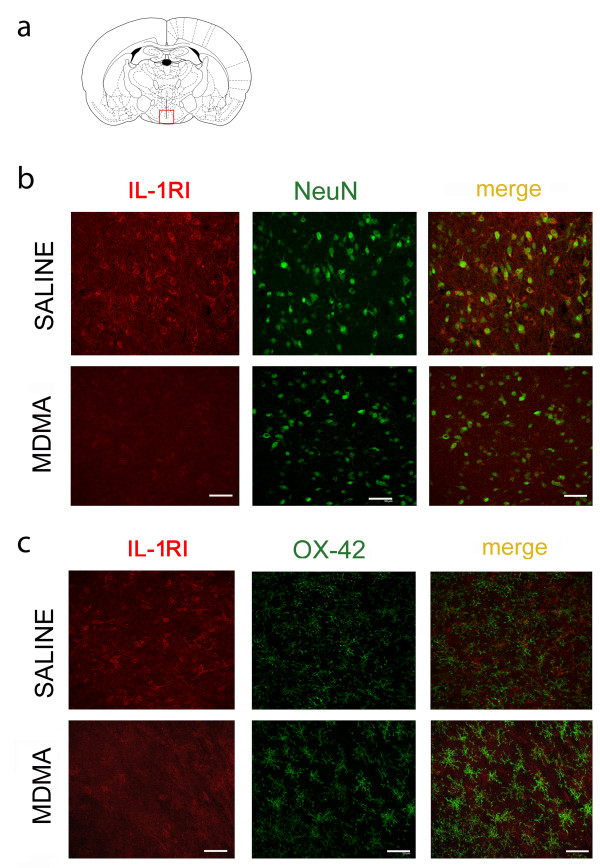
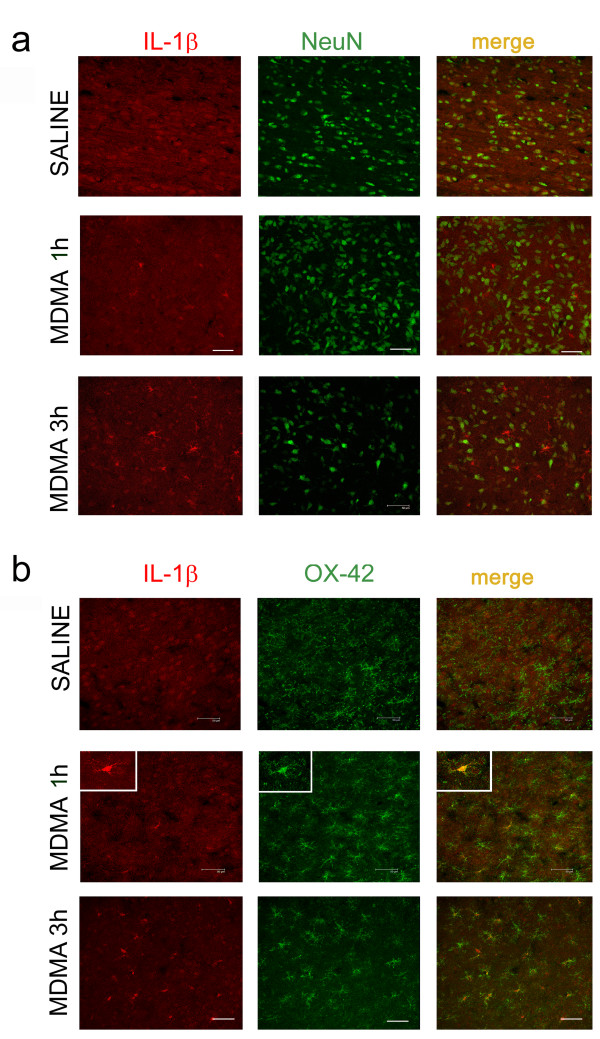
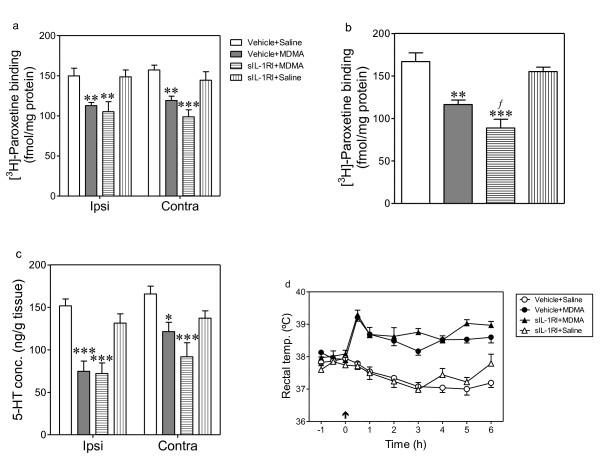
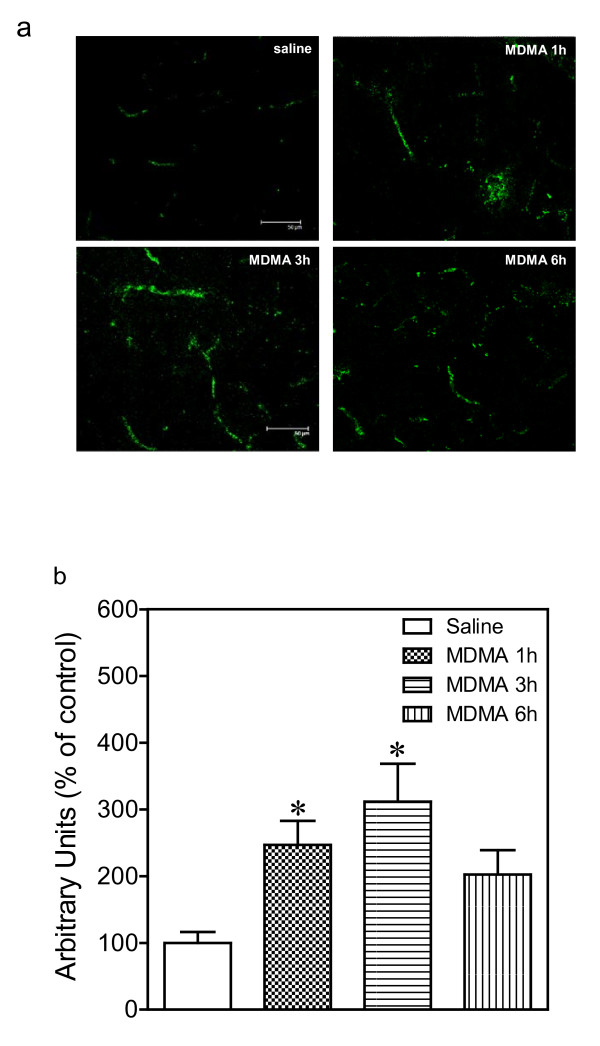
Methods: Dark Agouti rats received MDMA (12.5 mg/kg, i.p.) and levels of IL-1ra and expression of IL-1RI measured 1 h, 3 h or 6 h later. JWH-015 (2.4 mg/kg, i.p.) was injected 48 h, 24 h and 0.5 h before MDMA and IL-1ra and IL-1RI measured. For localization studies, animals were sacrificed 1 h or 3 h following MDMA and stained for IL-1β or IL-1RI in combination with neuronal and microglial markers. sIL-1RI (3 μg/animal; i.c.v.) was administered 5 min before MDMA and 3 h later. 5-HT transporter density was determined 7 days after MDMA injection.

Results: MDMA produced an increase in IL-ra levels and a decrease in IL-1RI expression in hypothalamus which was prevented by CB2 receptor activation. IL-1RI expression was localized on neuronal cell bodies while IL-1β expression was observed in microglial cells following MDMA. sIL-1RI potentiated MDMA-induced neurotoxicity. MDMA also increased IgG immunostaining indicating that blood brain-barrier permeability was compromised.

Conclusions: In summary, MDMA produces changes in IL-1 signal modulators which are modified by CB2 receptor activation. These results indicate that IL-1β may play a partial role in MDMA-induced neurotoxicity.


Figures

Figure 1
Figure 1
Time-course of the changes induced by MDMA (12.5 mg/kg, i.p.) on IL-1ra (endogenous antagonist of IL-1 receptor) levels in a) frontal cortex and b) hypothalamus. IL-1ra levels were measured 1 h, 3 h and 6 h after drug injection. Results shown as mean ± SEM (n = 6-8). Different from saline: ***p < 0.001. Different from MDMA-treated group at 1 h: fffp < 0.001.
Figure 2
Figure 2
Time-course of the changes induced by MDMA (12.5 mg/kg, i.p.) on IL-1RI expression in the frontal cortex (a) and hypothalamus (b). IL-1RI expression was measured 1 h, 3 h and 6 h after drug injection. Results shown as mean ± SEM (n = 5-13). Different from saline: *p < 0.05, **p < 0.01. A representative western blot shows immunoreactivity in frontal cortex (c) and hypothalamus (d).
Figure 3
Figure 3
Fluorescence images (40×) showing IL-1RI immunoreactivity (red staining) in hypothalamus of saline- and MDMA (12.5 mg/kg, i.p.)-treated rats (3 hours after injection). Double immunofluorescence with IL-1RI and NeuN (green staining, b: upper panel) or OX-42 (green staining, b: lower panel) revealed that IL-1RI is localized on neuronal cells, not on activated microglia. Scale bar = 50 μm. a: image showing area studied.
Figure 4
Figure 4
Fluorescence images (40×) showing IL-1β immunoreactivity in the hypothalamus of saline- and MDMA (12.5 mg/kg, i.p.)-treated rats (1 h and 3 h after injection). Double immunofluorescence with IL-1β (red staining) and NeuN or OX-42 (both green staining, upper and lower panels respectively) revealed that IL-1β is constitutively expressed in neurons and that following MDMA the immunoreactivity for IL-1β overlaps with OX-42 immunostaining. Scale bar = 50 μm. Inset shows a stained microglial cell (63×). Same brain sections were studied as indicated in Figure 3a.
Figure 5
Figure 5
Effect of JWH-015 on the MDMA-induced changes in IL-1ra levels (a) and IL-1RI expression (b) in hypothalamus. JWH-015 (2.4 mg/kg, i.p.) was injected 48 h, 24 h, and 0.5 h before MDMA (12.5 mg/kg, i.p.). For IL-1ra levels determination rats were killed 1 h after MDMA administration (a). IL-1RI expression was measured 3 h after MDMA (b). The effect of JWH-015 on MDMA-induced hyperthermia is also shown (d,e). Results shown as mean ± SEM (n = 4-8). Different from vehicle + saline group: *p < 0.05, ***p < 0.001. Different from vehicle + MDMA-treated group: fp < 0.05, ffp < 0.01. In panels (d, e) different from vehicle + saline group: *p < 0.001. A representative western blot shows immunoreactivity in hypothalamus (c).
Figure 6
Figure 6
Effect of intracerebroventricular injection of sIL-1RI on the MDMA-induced reduction of 5-HT transporters in frontal cortex and hypothalamus (a,b), cortical 5-HT concentration (c) and hyperthermia (d). sIL-1RI (3 μg) was administered 5 min before and 3 h after MDMA (12.5 mg/kg, i.p.), rats being killed 7 days later. Results shown as mean ± SEM (n = 5-9). Different from vehicle + saline group: *p < 0.05, ** p < 0.01, ***p < 0.001. Different from vehicle + MDMA-treated group: fp < 0.05. In panel (d) different from vehicle + saline group: *p < 0.001.
Figure 7
Figure 7
Time-course of the changes induced by MDMA (12.5 mg/kg, i.p.) on IgG expression in hypothalamus. Fluorecence images (40×) of representative IgG immunostained sections (a) of hypothalamus and quantification of intensity of immunostaining (b). Scale bar = 50 μm. Rats were killed 1 h, 3 h and 6 h after MDMA injection. Results shown as mean ± SEM (n = 4-6). Different from saline: *p < 0.05.

References

    1. Sharkey J, McBean DE, Kelly PA. Alterations in hippocampal function following repeated exposure to the amphetamine derivative methylenedioxymethamphetamine ("Ecstasy") Psychopharmacology. 1991;105:113–118. doi: 10.1007/BF02316872. - DOI - PubMed
    1. Hewitt KE, Green AR. Chlormethiazole, dizocilpine and haloperidol prevent the degeneration of serotonergic nerve terminals induced by administration of MDMA ('Ecstasy') to rats. Neuropharmacology. 1994;33:1589–1595. doi: 10.1016/0028-3908(94)90134-1. - DOI - PubMed
    1. Colado MI, O'Shea E, Granados R, Murray TK, Green AR. In vivo evidence for free radical involvement in the degeneration of rat brain 5-HT following administration of MDMA ('ecstasy') and p-chloroamphetamine but not the degeneration following fenfluramine. Br J Pharmacol. 1997;121:889–900. doi: 10.1038/sj.bjp.0701213. - DOI - PMC - PubMed
    1. Sanchez V, Camarero J, Esteban B, Peter MJ, Green AR, Colado MI. The mechanisms involved in the long-lasting neuroprotective effect of fluoxetine against MDMA ('ecstasy')-induced degeneration of 5-HT nerve endings in rat brain. Br J Pharmacol. 2001;134:46–57. doi: 10.1038/sj.bjp.0704230. - DOI - PMC - PubMed
    1. O'Shea E, Orio L, Escobedo I, Sanchez V, Camarero J, Green AR, Colado MI. MDMA-induced neurotoxicity: long-term effects on 5-HT biosynthesis and the influence of ambient temperature. Br J Pharmacol. 2006;148:778–785. - PMC - PubMed

Publication types

MeSH terms

Substances