

Multi-source analysis reveals latitudinal and altitudinal shifts in range of Ixodes ricinus at its northern distribution limit
- PMID: 21595949
- PMCID: PMC3123645
- DOI: 10.1186/1756-3305-4-84
Multi-source analysis reveals latitudinal and altitudinal shifts in range of Ixodes ricinus at its northern distribution limit
Abstract
Background: There is increasing evidence for a latitudinal and altitudinal shift in the distribution range of Ixodes ricinus. The reported incidence of tick-borne disease in humans is on the rise in many European countries and has raised political concern and attracted media attention. It is disputed which factors are responsible for these trends, though many ascribe shifts in distribution range to climate changes. Any possible climate effect would be most easily noticeable close to the tick's geographical distribution limits. In Norway- being the northern limit of this species in Europe- no documentation of changes in range has been published. The objectives of this study were to describe the distribution of I. ricinus in Norway and to evaluate if any range shifts have occurred relative to historical descriptions.
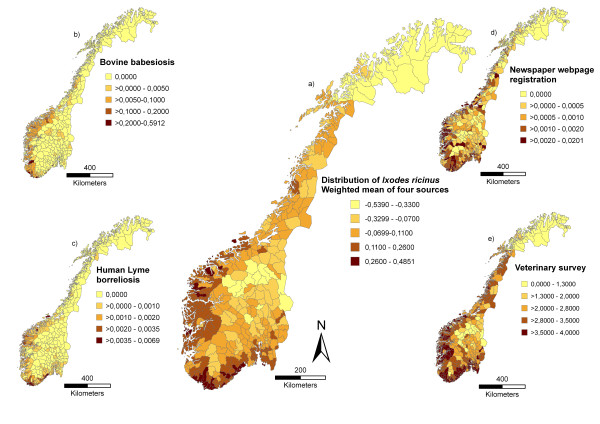
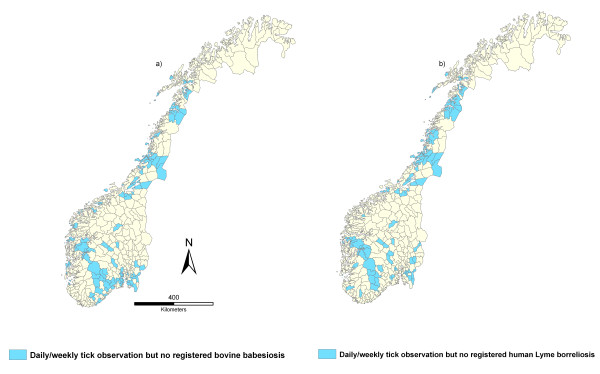
Methods: Multiple data sources - such as tick-sighting reports from veterinarians, hunters, and the general public - and surveillance of human and animal tick-borne diseases were compared to describe the present distribution of I. ricinus in Norway. Correlation between data sources and visual comparison of maps revealed spatial consistency. In order to identify the main spatial pattern of tick abundance, a principal component analysis (PCA) was used to obtain a weighted mean of four data sources. The weighted mean explained 67% of the variation of the data sources covering Norway's 430 municipalities and was used to depict the present distribution of I. ricinus. To evaluate if any geographical range shift has occurred in recent decades, the present distribution was compared to historical data from 1943 and 1983.
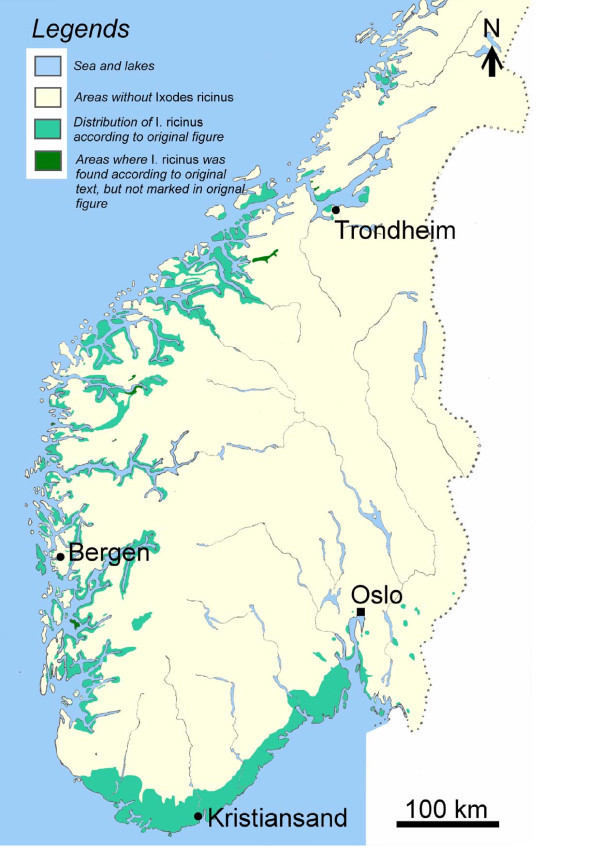
Results: Tick-borne disease and/or observations of I. ricinus was reported in municipalities up to an altitude of 583 metres above sea level (MASL) and is now present in coastal municipalities north to approximately 69°N.
Conclusion: I. ricinus is currently found further north and at higher altitudes than described in historical records. The approach used in this study, a multi-source analysis, proved useful to assess alterations in tick distribution.
Figures

References
-
- Randolph SE, Miklisova D, Lysy J, Rogers DJ, Labuda M. Incidence from coincidence: patterns of tick infestations on rodents facilitate transmission of tick-borne encephalitis virus. Parasitology. 1999;118(Pt 2):177–186. - PubMed
-
- Tambs-Lyche H. Ixodes ricinus og piroplasmosen i Norge (Meddelelse fra Bergens Museums zoologiske avdeling) Norsk veterinærtidsskrift. 1943;55:337–542.
-
- Mehl R. The distribution and host relations of Norwegian ticks (Acari, Ixodides) Fauna norvegica Series B. 1983;30:46–51.
MeSH terms
LinkOut - more resources
Full Text Sources
