

Review
doi: 10.1016/j.visres.2011.05.002.
Epub 2011 May 10.
Imaging single cells in the living retina
Affiliations
- PMID: 21596053
- PMCID: PMC3189497
- DOI: 10.1016/j.visres.2011.05.002
Item in Clipboard
Review
Imaging single cells in the living retina
Vision Res.
.
Abstract
A quarter century ago, we were limited to a macroscopic view of the retina inside the living eye. Since then, new imaging technologies, including confocal scanning laser ophthalmoscopy, optical coherence tomography, and adaptive optics fundus imaging, transformed the eye into a microscope in which individual cells can now be resolved noninvasively. These technologies have enabled a wide range of studies of the retina that were previously impossible.
Copyright © 2011 Elsevier Ltd. All rights reserved.
Conflict of interest statement
Conflict of Interest Disclosure: My employer, the University of Rochester, holds intellectual property on which I am an inventor and that pertain to the subject matter of this article.
Figures
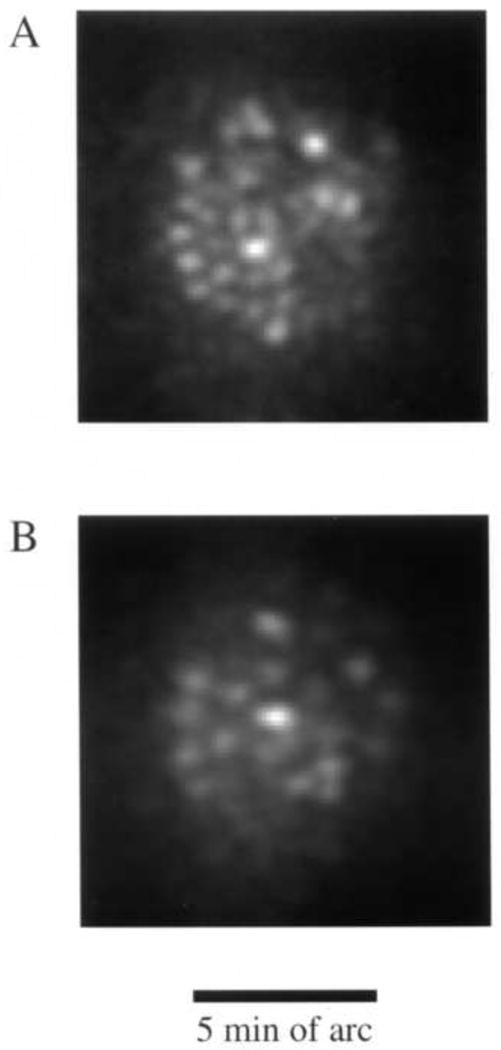
Some of the first images taken of the human photoreceptor mosaic in the human eye with a high magnification fundus camera and the method developed by Miller et al. (1996). A. Image obtained at 0.5 deg from the foveal center. B) Image obtained at 2.5 deg from the foveal center.
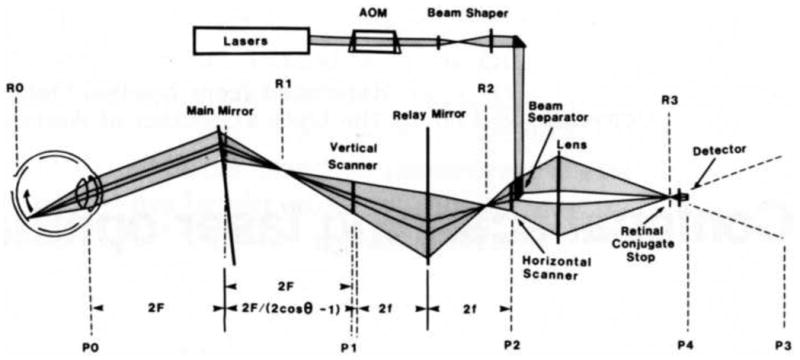
Optical layout of the first confocal SLO. The light path is shown at one instant in time. Mirrors are shown as transmissive for simplicity. Pupil conjugate planes are labeled with Pn. P3 is a virtual image of the pupil, converted to a real image at P4 by a microscope objective. Retinal conjugate planes are labeled with Rn. R3 corresponds to the confocal pinhole just in front of the light detector. From: Webb, R.H., Hughes, G.W., Delori, F.C., (1987).
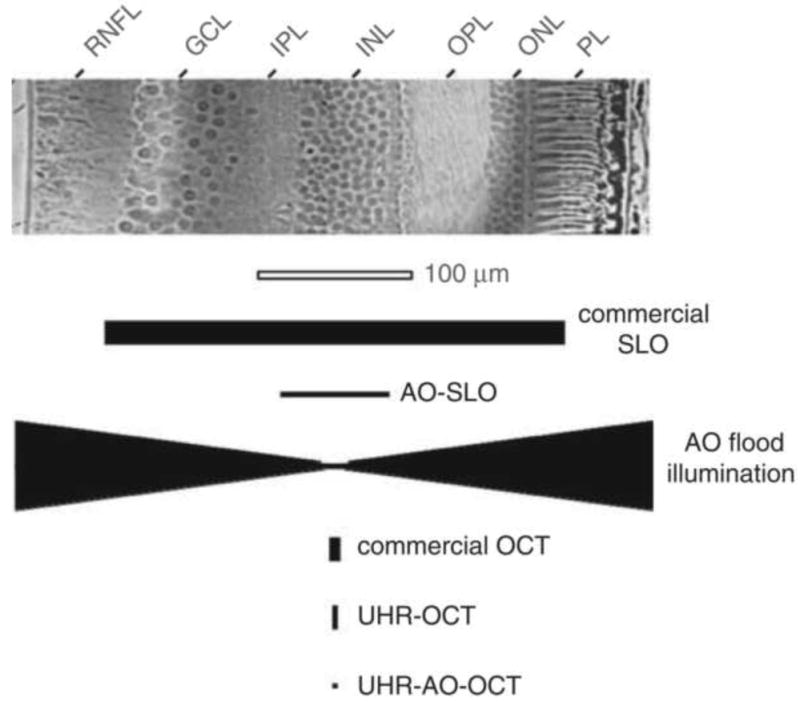
Comparison of (top) cell size in a histological cross section of the human retina with (bottom) the resolving capability of the major types of retinal imaging modalities with and without AO. The vertical and horizontal dimensions of the solid black symbols denote, respectively, the lateral and axial resolution of the instruments. Examples shown include the commercial confocal scanning laser ophthalmoscope (SLO), adaptive optics confocal scanning laser ophthalmoscope (AOSLO), adaptive optics flood illumination, commercial OCT, ultrahigh-resolution OCT (UHR–OCT), and ultrahigh-resolution OCT with adaptive optics (UHR–AO– OCT). GCL, ganglion cell layer; IPL, inner plexiform layer; INL, inner nuclear layer; OPL, outer plexiform layer; ONL, outer nuclear layer; PL, photoreceptor layer; RNFL, retinal nerve fiber layer. From Miller (2011).
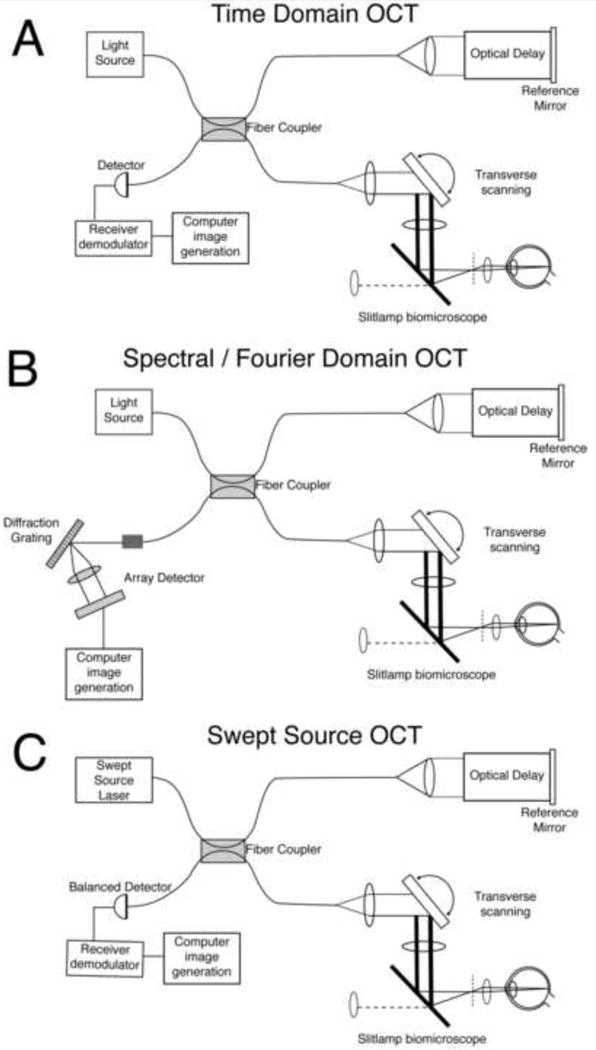
Three methods that use low coherence interferometry to acquire high resolution depth information from the retina. A) Time domain OCT B) Spectral or Fourier Domain OCT. C) Swept Source OCT. See text for details. Adapted from Fujimoto (2003).
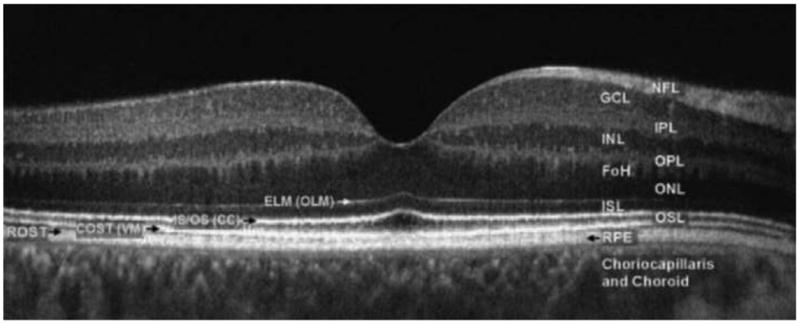
Fourier-domain optical coherence tomography (FD-OCT) B-scan of the fovea from a normal 34-year-old volunteer acquired with a FD-OCT instrument scanning 5mm laterally. The instrument was built by Jack Werner's group at UC, Davis. Abbreviations: FoH, fibers of Henle; GCL, ganglion cell layer; INL, inner nuclear layer; IPL, inner plexiform layer; ISL, inner segment layer; NFL, nerve fiber layer; ONL, outer nuclear layer; OPL, outer plexiform layer; OSL, outer segment layer; RPE, retinal pigment epithelium, choriocapillaris and choroid. The outer limiting membrane (OLM; sometimes called external limiting membrane (ELM)), connecting cilia (CC; sometimes called inner/outer segment junction), Verhoeff's membrane (VM; sometimes called cone photoreceptor outer segment tips (COST)) and rod photoreceptor outer segment tips (ROST) may also be seen. ROST and RPE appear as one layer in the fovea but are visible as separate layers in the periphery. From Werner et al. (2011).
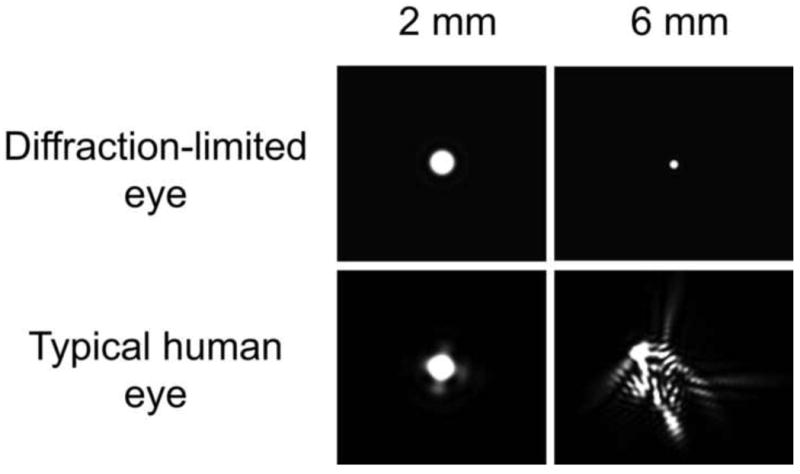
The point spread function (PSF) for a diffraction-limited eye and a normal eye at two different pupil diameters. The PSF corresponds to the light distribution on the retina produced by a point source of light infinitely distant from the eye. For the hypothetical diffraction-limited eye, the PSF diameter decreases in inverse proportion to the pupil diameter such that large pupils produce the best image quality. However, in the typical human eye, aberrations increase with increasing pupil size, eliminating the benefit of escaping diffraction at the largest pupils. The goal of AO is to correct the aberrations to produce the PSF of a diffraction-limited eye with a large pupil. (From Yin and Williams, 2010)
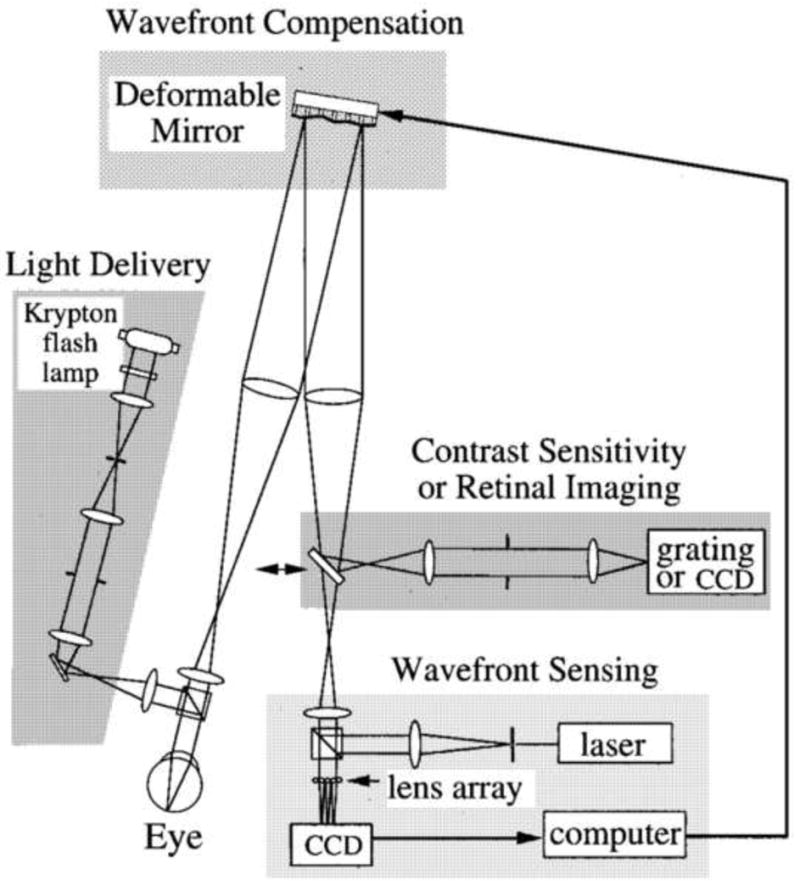
Optical layout of the first adaptive optics fundus camera that could correct higher order aberrations of the human eye. Wave-front sensing and adaptive compensation. The eye focused a collimated laser beam onto the retina. The light reflected from the retina formed an aberrated wave front at the pupil. The distorted wave front was measured by a Hartmann–Shack wave-front sensor. A deformable mirror, conjugate with the pupil, compensated for the eye's wave aberration. After compensation was achieved, psychophysical or retinal imaging experiments could be performed with a 6-mm pupil. Retinal imaging. A krypton flash lamp delivered a 4-ms flash, illuminating a retinal disk 1 deg in diameter. A scientific-grade CCD acquired images of the retina. From Liang et al. (1997).
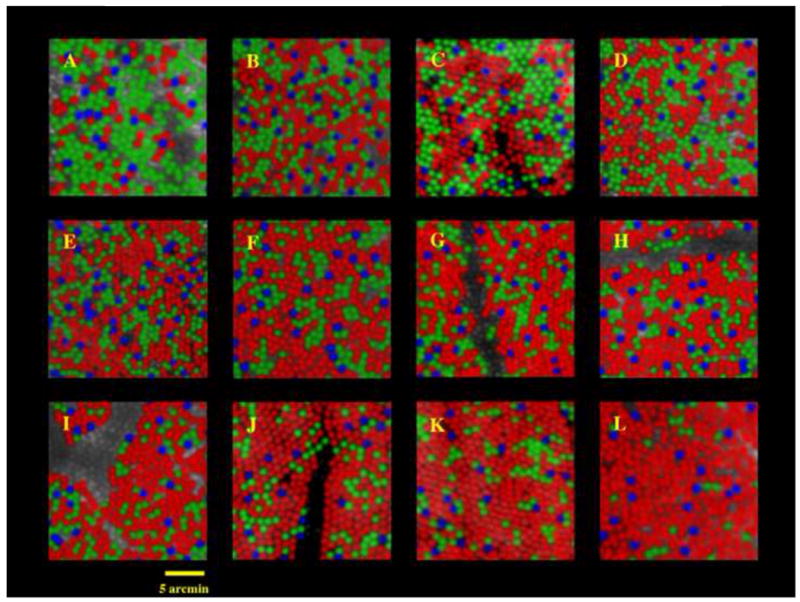
Images of the cone mosaics of 10 subjects with normal color vision, obtained with the combined methods of adaptive optics imaging and retinal densitometry. The images are false colored so that blue, green, and red are used to represent the S, M, and L cones respectively. (The true colors of these cones are yellow, purple, and bluish-purple). The mosaics illustrate the enormous variability in L/M cone ratio. The L/M cone ratios are A,0.37, B, 1.11, C, 1.14, D, 1.24, E, 1.77, F, 1.88, G, 2.32, H, 2.36, I, 2.46, J, 3.67, K, 3.90, L, 16.54. The proportion of S cones is relatively constant across eyes, ranging from 3.9 to 6.6% of the total population. Images were taken either 1 or 1.25 deg from the foveal center. For two of the 10 subjects, two different retinal locations are shown. Panels D and E show images from nasal and temporal retinas respectively for one subject; J and K show images from nasal and temporal retinas for another subject. Images C, J, and K are from Roorda and Williams (1999). All other images are from Hofer et al. (2004). From Williams and Hofer, H. (2003).
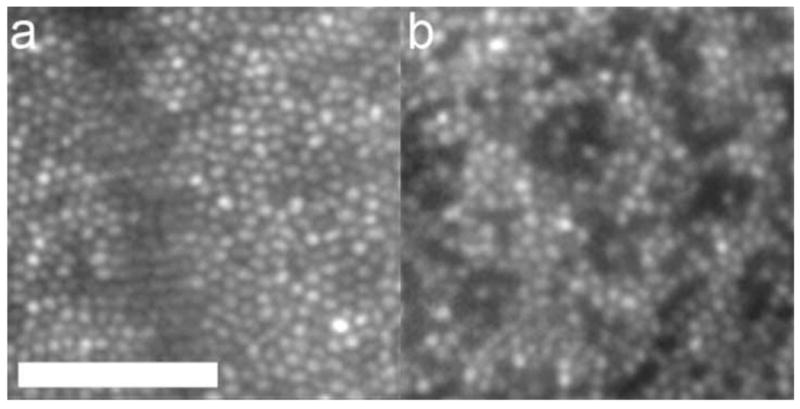
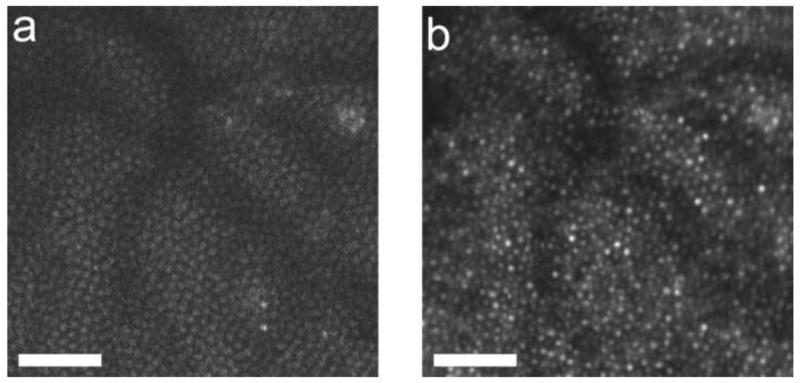
AO reveals cone mosaics in two kinds of color blindness. (a) Dichromat with cone mosaic indistinguishable from a normal trichromat. (b) Dichromat with M pigment mutation showing dark regions where cones may be damaged or lost; despite the disruption in the cone mosaic this person has excellent spatial vision. Scale is identical for each panel; scale bar is 50 microns. From Carroll et al. (2004).
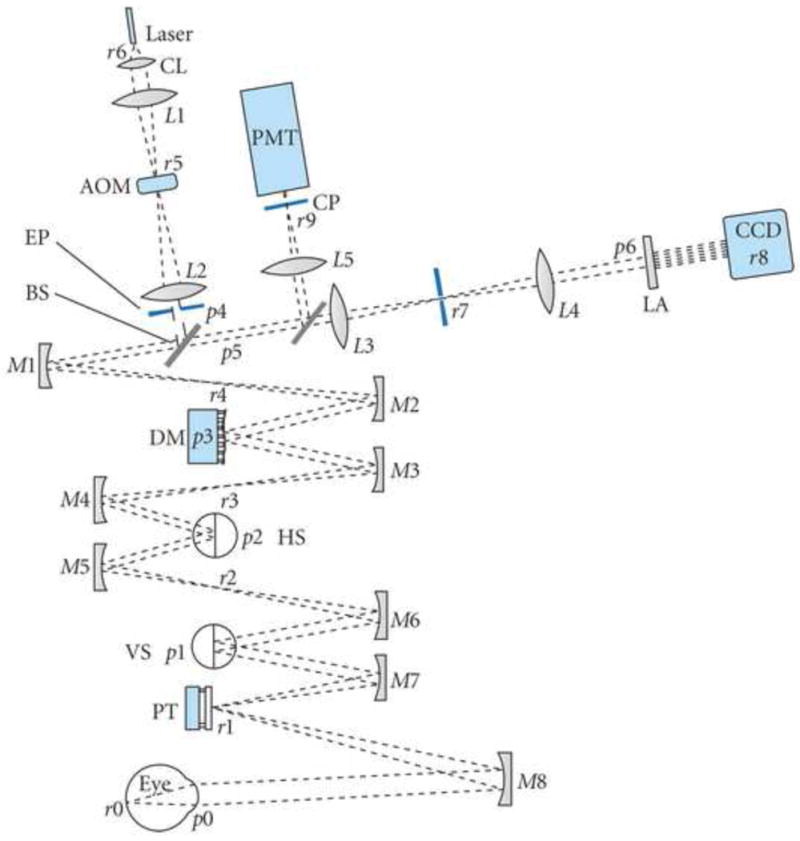
Schematic of an adaptive optics scanning laser ophthalmoscope invented by Austin Roorda. Key: CL—collimating lens; AOM—acousto-optic modulator; EP—entrance pupil; BS1—beamsplitter 1; DM—deformable mirror; HS—horizontal scanning mirror; VS—vertical scanning mirror; PT—pupil tracking mirror; LA—lenslet array; CP—confocal pinhole; PMT—photomultiplier tube. Pupil and retinal conjugates are labeled p and r, respectively. Mirrors and lenses are labeled M# and L# along the optical path. Telescope lens/mirror-pairs for relaying the pupil through the path are L1–L2, L3–L4, M1–M2, M3–M4, M5–M6, and M7–M8. From Miller and Roorda (2009).
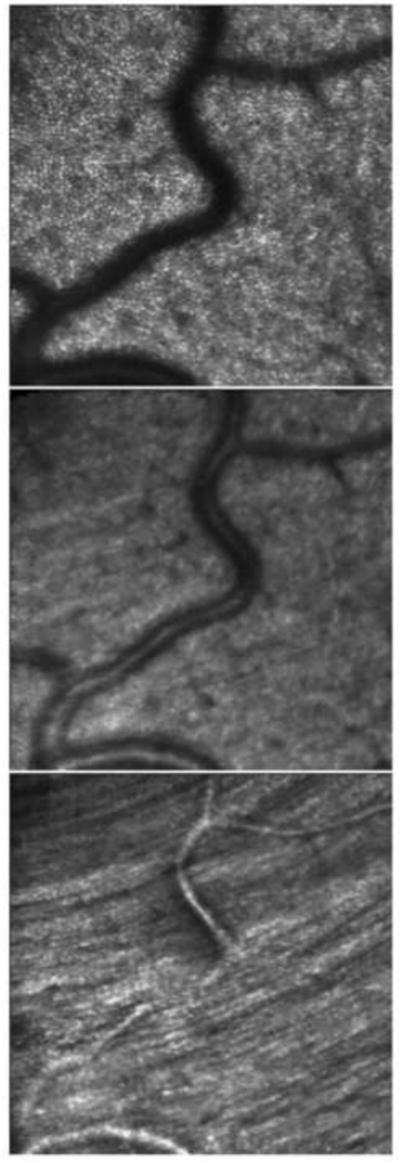
Optical sectioning of the retinal layers. In the top panel, the AOSLO is focused at the external limiting membrane and shows the mosaic of cone photoreceptors. The middle panel is an optical section of the inner retina, showing light scattered from the blood vessels. The bottom panel is an optical section with the focus on the surface of the retina, showing the striation of the nerve fiber bundles. The image is from a location about 4° inferior to the foveal center. From Roorda (2010).
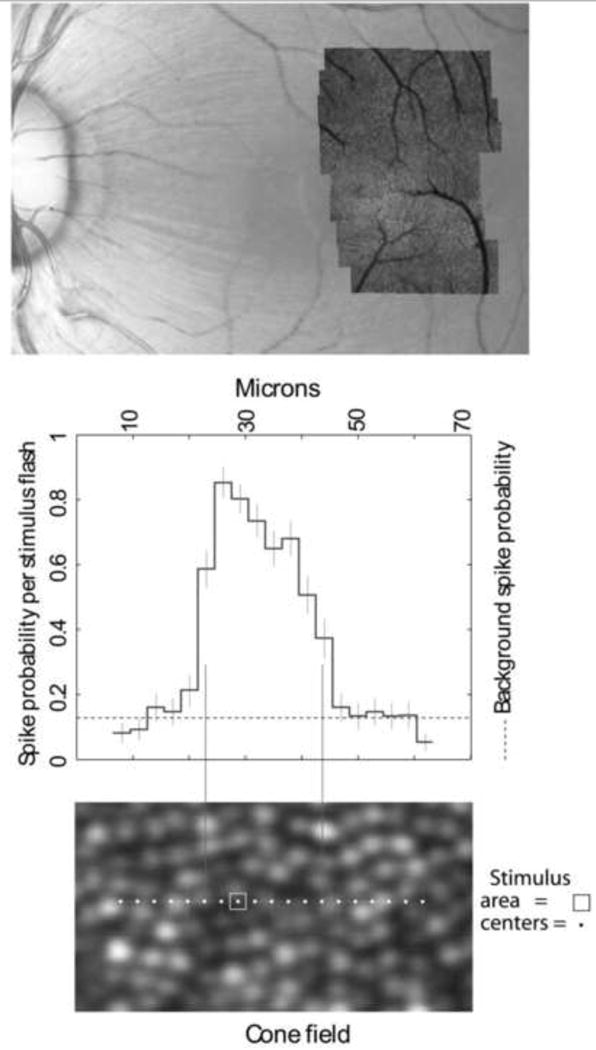
Mapping single cone cell inputs to the receptive fields of LGN cells recorded with a microelectrode in the monkey. Upper panel: color fundus photograph of macaque retina with an AOSLO montage overlay. The red dot indicates the location of the receptive field that is shown in the two lower panels. The lower panel shows the exact locations of the test areas. The central plot shows the probability that each stimulus flash will produce a neural spike (Adapted from Sincich et al., 2009). From Roorda (2010).
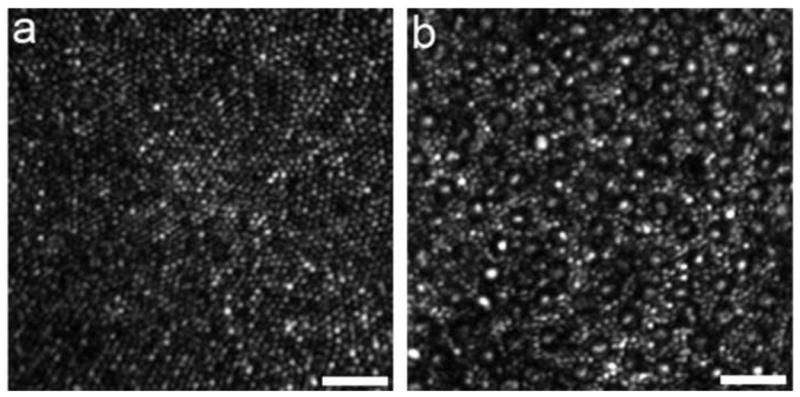
High-resolution images of the smallest photoreceptors obtained with the new Rochester AOSLO. (a) The complete foveal cone mosaic. (b) The complete peripheral photoreceptor mosaic showing both rods and cones, imaged at 101 temporal and 11 inferior. Scale bars are 20 microns. From Rossi et al. (2011).
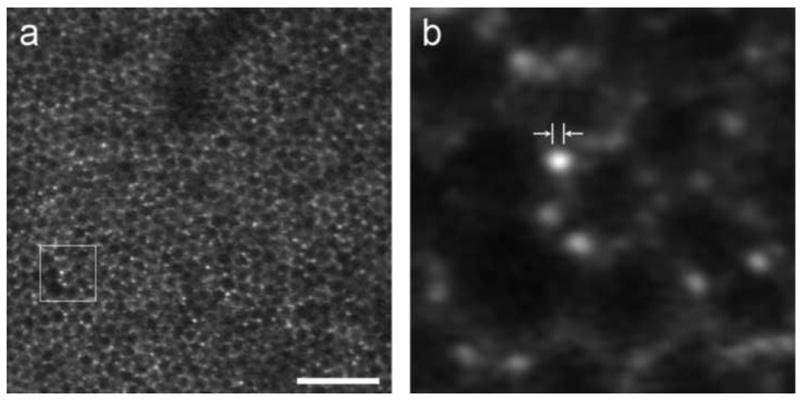
Retinal pigment epithelium and individual lipofuscin granules revealed in FAOSLO. (a) Individual RPE cells imaged using FAOSLO in macaque. Scale bar is 100 microns. (b) Outlined region from a showing individual lipofuscin granules; distance between arrowheads is 2 microns, on the order of the size expected for RPE granules. From Rossi 2011.
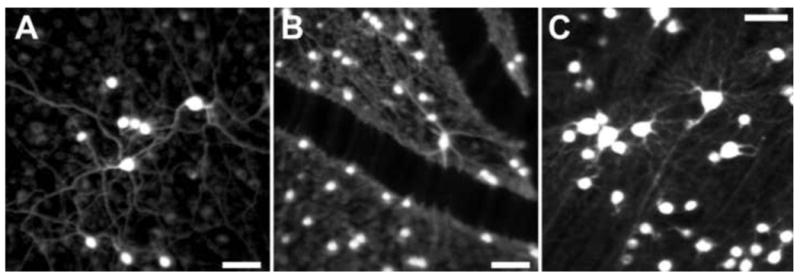
Fluorescence AOSLO images of primate retinal ganglion cells in vivo A), B) and C) Fluorescence AOSLO imaging revealed the morphology of retinal ganglion cells labeled with fluorophore (rhodamine dextran) in living monkey eye. The transverse resolution of the images is fine enough to resolve the individual dendrites. The fluorophore was introduced into the ganglion cells through retrograde labeling via injections in the lateral geniculate nucleus (LGN). Scale bar of 50 μm in all panels. [Panels A and C, Reproduced from Gray DC, Wolfe R, Gee BP, et al. (2008) In vivo imaging of the fine structure of rhodamine-labeled macaque retinal ganglion cells. Invest Ophthalmol Vis Sci 49:467-473, their Figures 1 and 5, with permission from Association for Research in Vision and Ophthalmology (Copyright 2008).]
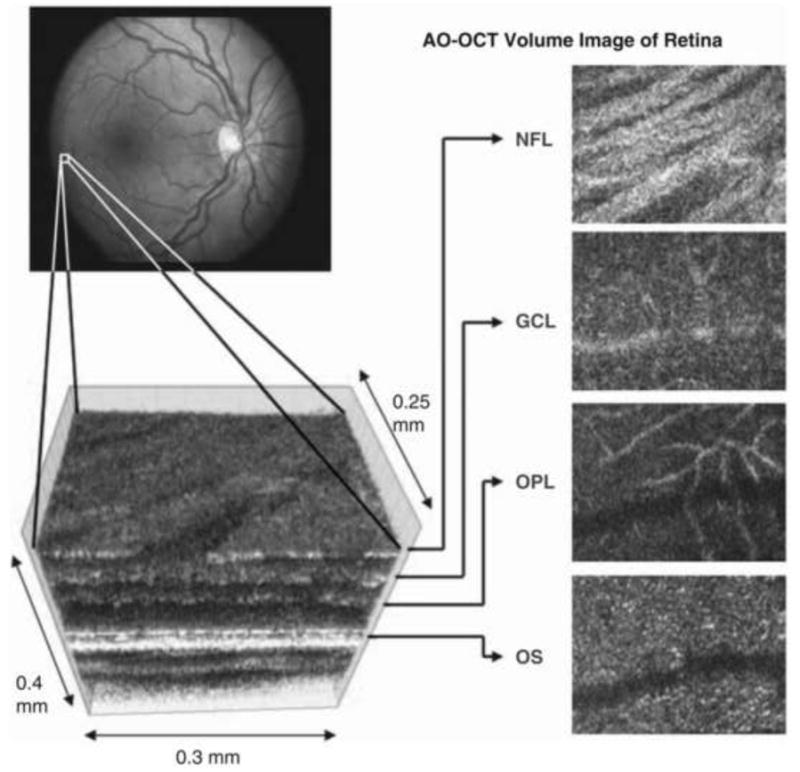
AO–OCT volume acquired over a 1deg retinal region located temporal of the fovea, as illustrated by the rectangle in the fundus photograph. The images on the right are en face views of particular retinal layers extracted from the AO–OCT volume. Retinal layers from top to bottom are: nerve fiber layer (NFL), ganglion cell layer (GCL), outer plexiform layer (OPL), and outer segment layer of photoreceptors (OS). (from Miller, 2011)
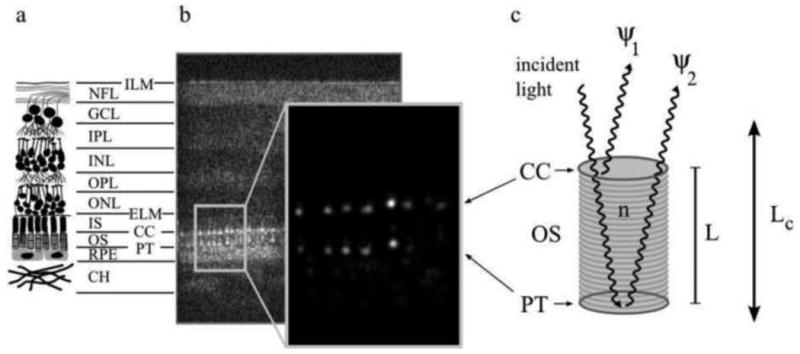
The reflective structure of the retina showing the two bright reflections especially from the cone photoreceptors that are the basis for cellular interferometry. (a) A diagram depicting the major layers of the neural retina, consisting of the inner limiting membrane (ILM), nerve fiber layer (NFL), ganglion cell layer (GCL), inner plexiform layer (IPL), inner nuclear layer (INL), outer plexiform layer (OPL), outer nuclear layer (ONL), external limiting membrane (ELM), the inner segments (IS) and outer segments (OS) (which make up the photoreceptor layer), the connecting cilia (CC) and posterior tip (PT) layers (which bound the outer segment), the retinal pigment epithelium (RPE), and the choroid (CH). (b) An AO-OCT B-scan (log intensity), showing a cross-section of the full retinal thickness, aligned with the layers depicted in (a), and an enlarged view (linear intensity) of the cone outer segments. While OCT images are typically shown in log intensity, the linear intensity view of the outer segments demonstrates vividly that the bulk of the cone reflection originates at the CC and PT layers: the bright, patterned reflections at the CC and PT layers are the most visible structures in the linear intensity image; their peak intensity is more than two orders of magnitude greater than the average intensity of all other layers in the image. Each distinct reflection in the pattern represents a single cone cell. (c) A model of light propagation through the OS. Two bright reflections (ψ1 and ψ2) originate from the CC and PT layers, creating a biological interferometer in the retina that is sensitive to small (≪ λ) changes in the outer segment length L whenever the temporal coherence length of the illumination source Lc is longer than L. From Jonnal et al. (2010)
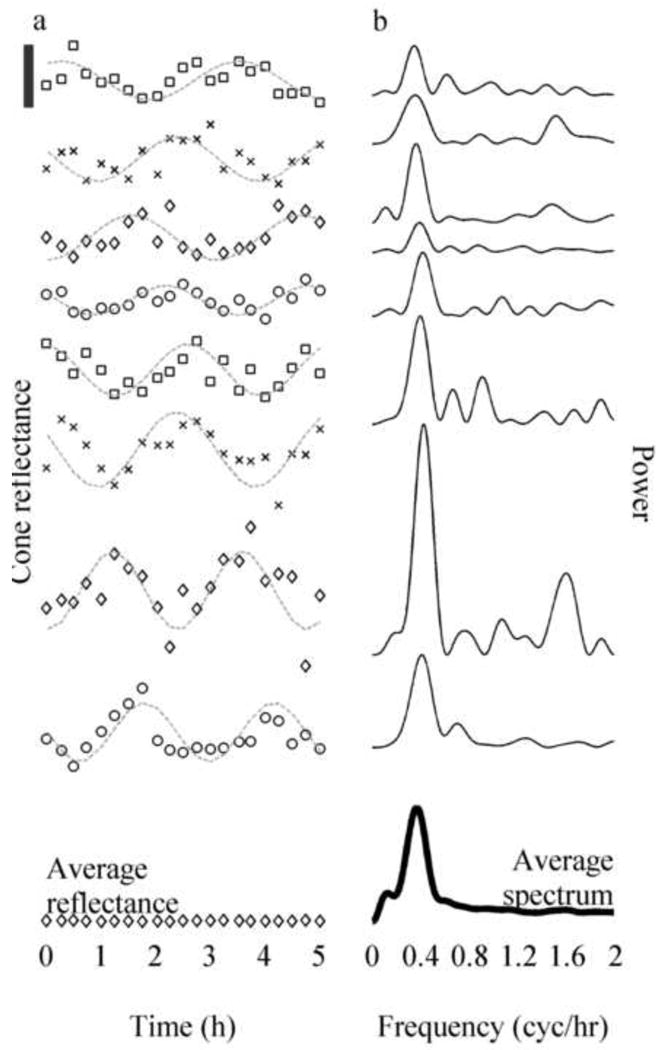
Cone reflectances and their power spectra (plots offset vertically for ease of viewing). (a) Reflectance as a function of time of eight sample cones taken from trial 4. Superimposed on each plot is a cosine fit (gray line). The black bar in the upper left shows 1/10th of the average DC component, I0, of cone reflectance. The oscillation of reflectance in all cones had a visible period of 2.5 – 3 hours, while the amplitudes and phases appeared to vary randomly. At the bottom is a plot of the average reflectance of all cones (diamonds), nearly flat (contrast 0.18%), which is predicted by the model shown in Fig. 1(c) and Eq. (1). (b) Power spectra of mean-subtracted cone reflectance traces shown in a, and the average spectrum of all 1626 cones (dark line). Most cones in this trial had a visible peak in the power spectrum around 0.37 cyc/hr, and this peak is visible in the average power spectrum as well. Similar peaks were seen in power spectra of individual cones, and the average power spectrum, in all trials in which the long coherence source was used (these frequencies are summarized in Table 1). When the short coherence source was used, neither the power spectra of individual cones nor the average power spectrum showed comparable peaks. From Jonnal et al. (2010).
A. two-photon image of the cone mosaic in the living primate retina at 2.5 deg superior retina using 730 nm illumination from a Ti-Sapph laser with a pulse width of less than 70 fs. B. Reflectance image of the cone mosaic at the same location using 790 nm light. The bright spots in both images correspond, confirming the cone mosaic as the origin of the two photon signal. Scale bar, ?0 μm.
References
-
- Arathorn DW, Yang Q, Vogel CR, Zhang Y, Tiruveedhula P, Roorda A. Retinally stabilized cone-targeted stimulus delivery. Opt Express. 2007;15:13731–13744. - PubMed
-
- Artal P, Chen L, Fernandez EJ, Singer B, Manzanera S, Williams DR. Adaptive optics for vision: the eye's adaptation to point spread function. J Refract Surg. 2003;19(5):S585–7. - PubMed
-
- Artal P, Manzanera S, Piers P, Weeber H. Visual effect of the combined correction of spherical and longitudinal chromatic aberrations. Opt Express. 2010;18(2):1637–1648. - PubMed
-
- Artal P, Navarro R. High-resolution imaging of the living human fovea: measurement of the intercenter cone distance by speckle interferometry. Optics Letters. 1989;14:1098–1100. - PubMed
-
- Atchison DA, Guo H, Charman WN, Fisher SW. Blur limits for defocus, astigmatism and trefoil. Vis Res. 2009;49(19):2393–2403. - PubMed
Publication types
MeSH terms
Grants and funding
- R01 EY009339/EY/NEI NIH HHS/United States
- P30 EY001319/EY/NEI NIH HHS/United States
- R43 EY020715/EY/NEI NIH HHS/United States
- R01 EY004367/EY/NEI NIH HHS/United States
- R01-EY009339/EY/NEI NIH HHS/United States
- R01-EY004367/EY/NEI NIH HHS/United States
- R43-EY020715/EY/NEI NIH HHS/United States
- T32 EY007125/EY/NEI NIH HHS/United States
- T32-EY007125/EY/NEI NIH HHS/United States
- R01 EY014375/EY/NEI NIH HHS/United States
- R24-EY021126/EY/NEI NIH HHS/United States
- R24 EY021126/EY/NEI NIH HHS/United States
- P30-EY001319/EY/NEI NIH HHS/United States
- BRP-EY014375/EY/NEI NIH HHS/United States
LinkOut - more resources
Full Text Sources
Other Literature Sources
