. 2011 May 20;42(4):413-25.
doi: 10.1016/j.molcel.2011.04.016.

Resolution of gene regulatory conflicts caused by combinations of antibiotics

Affiliations

Resolution of gene regulatory conflicts caused by combinations of antibiotics

Tobias Bollenbach et al. Mol Cell. .

Abstract

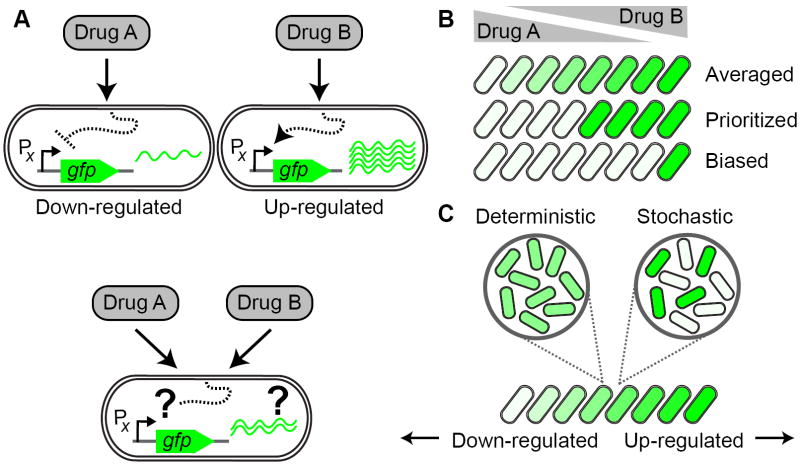
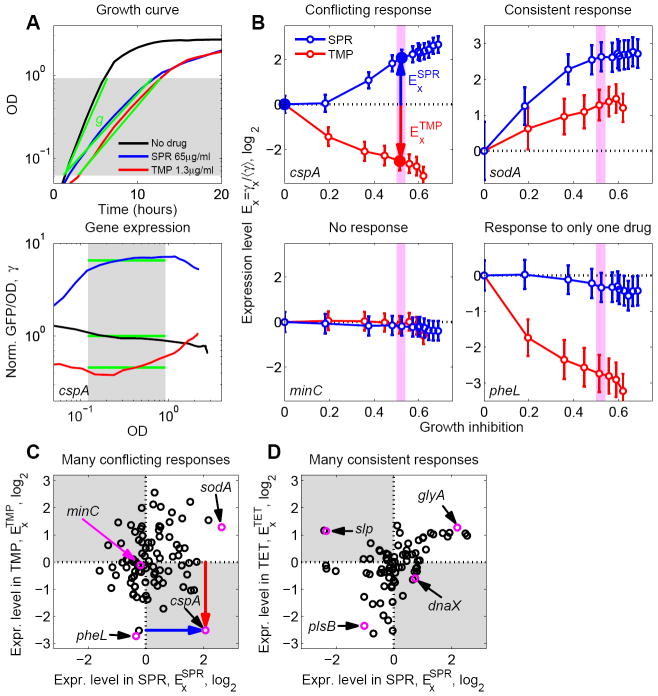
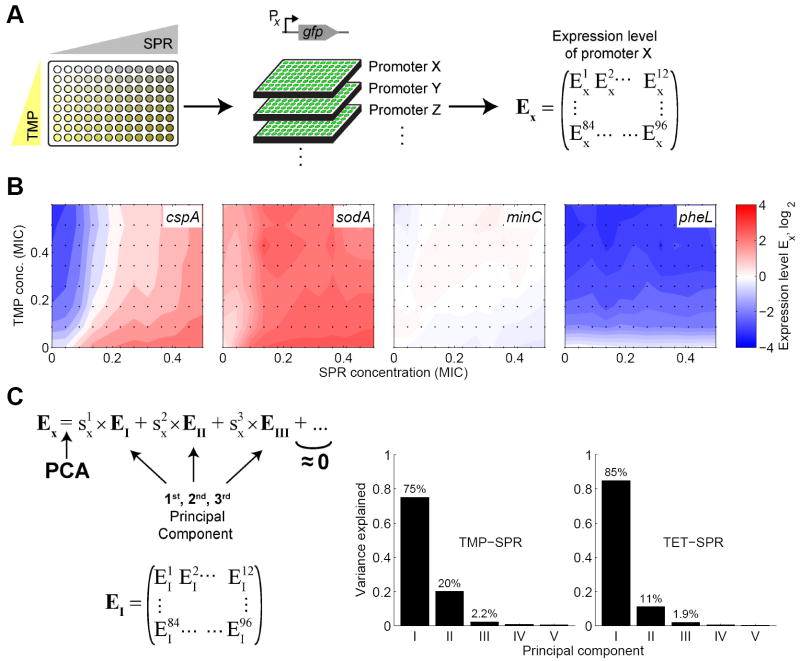
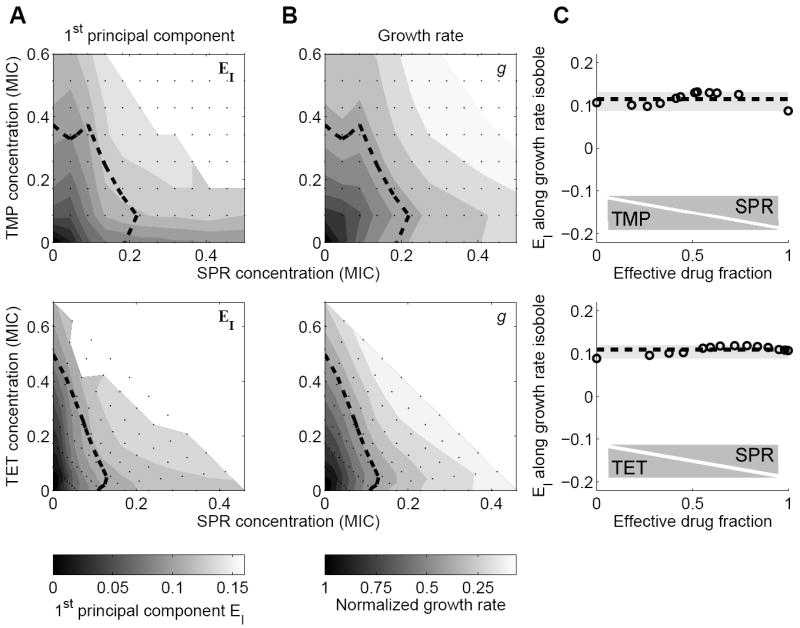
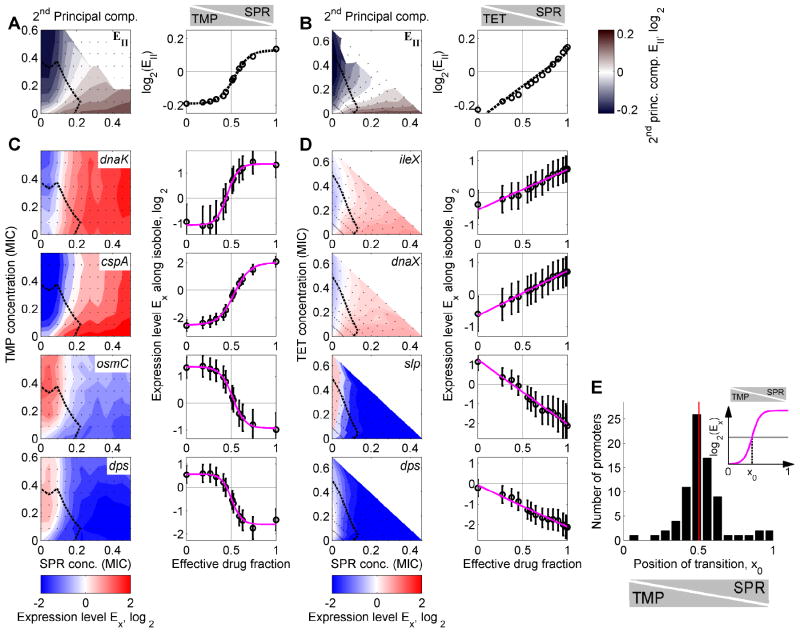
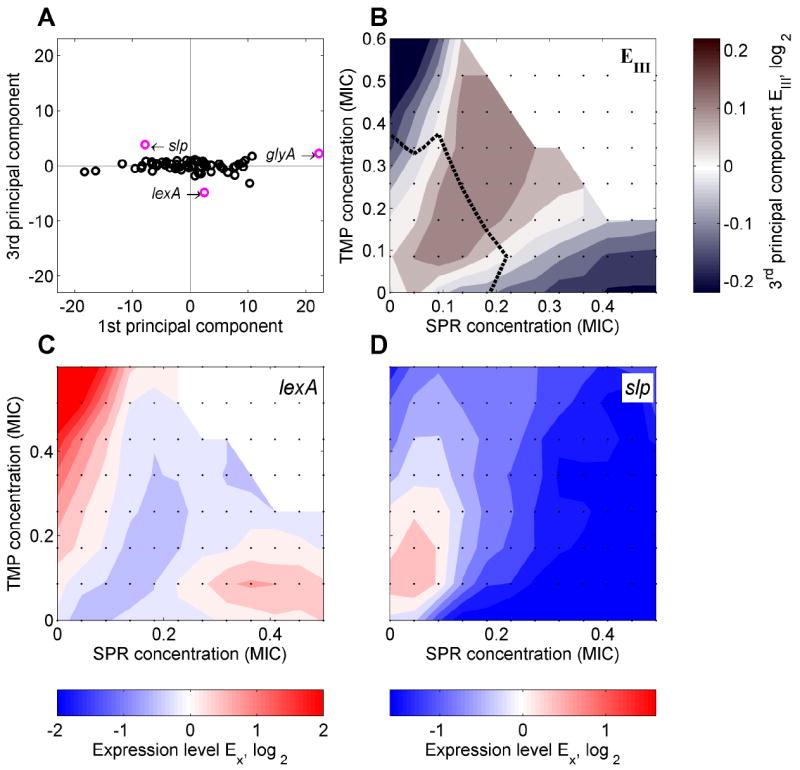
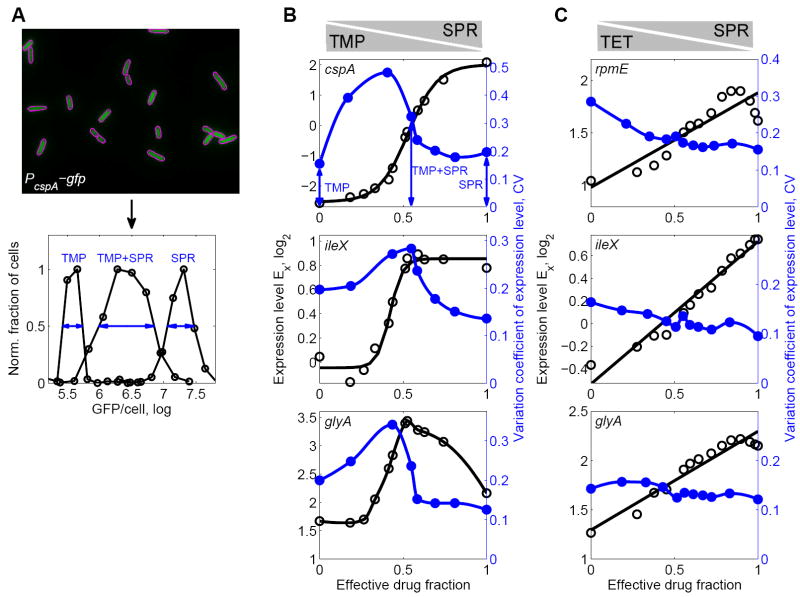
Regulatory conflicts occur when two signals that individually trigger opposite cellular responses are present simultaneously. Here, we investigate regulatory conflicts in the bacterial response to antibiotic combinations. We use an Escherichia coli promoter-GFP library to study the transcriptional response of many promoters to either additive or antagonistic drug pairs at fine two-dimensional (2D) resolution of drug concentration. Surprisingly, we find that this data set can be characterized as a linear sum of only two principal components. Component one, accounting for over 70% of the response, represents the response to growth inhibition by the drugs. Component two describes how regulatory conflicts are resolved. For the additive drug pair, conflicts are resolved by linearly interpolating the single drug responses, while for the antagonistic drug pair, the growth-limiting drug dominates the response. Importantly, for a given drug pair, the same conflict resolution strategy applies to almost all genes. These results provide a recipe for predicting gene expression responses to antibiotic combinations.


Figures

Figure 1
Figure 1. How do bacteria resolve conflicts in gene regulation caused by simultaneous exposure to two different drugs?
(A) Schematic example for a conflict in gene regulation: Promoter X is down-regulated in response to drug A, but up-regulated in response to drug B. How is promoter X regulated when the cell is faced with a combination of both drugs A and B? (B) In the combination of two drugs, cells may linearly superpose the response to the individual drugs (‘averaged response’, top row) or respond only to one of the drugs while ignoring the presence of the other drug (‘prioritized response’, middle row), depending on the concentration ratio of the two drugs. In a prioritized response, both drugs may affect the cell’s response equally (middle row) or one of the drugs may have a stronger impact on the response (‘biased response’, bottom row; the response is biased towards drug A in the example shown). Down-regulation is indicated by white cell-interior, up-regulation by green. (C) At the single cell level, all cells may show the same response to the drug combination (‘deterministic response’, left) or different cells may randomly respond primarily to only one of the drugs in the combination (‘stochastic response’, right).
Figure 2
Figure 2. Gene regulation responses to pairs of antibiotics frequently show conflicts
(A) Example data demonstrating measurement of drug effect on growth rate and transcription reporters. Optical Density (OD) and GFP expression from various promoters (shown, as an example, is the cspA promoter) are measured as a function of time for various drug concentrations. Shown are no drug (black), 65μg/ml SPR (blue), and 1.3μg/ml TMP (red). Top: Growth rates are defined by linear regression (green lines) to the OD curves. Bottom: Expression level γ (green lines) is defined as GFP fluorescence intensity per OD, averaged over an OD range of exponential growth (shaded region) and normalized to no drug control (thus γ = 1 for the no drug control). (B) Normalized expression levels Ex of example promoters cspA, sodA, minC, and pheL as a function of growth inhibition in various concentrations of SPR (blue) and TMP (red). Growth inhibition is the fraction by which the growth rate in the absence of drug is reduced. For each promoter X, Ex is defined as expression level γx, normalized to the median expression level ⋨γ⋩ of all promoters in the same drug concentration (Experimental Procedures). The three larger filled points for cspA correspond to the drug concentrations shown in A. The promoter cspA shows a clear regulatory conflict for these two drugs. In contrast, sodA is consistently up-regulated in response to both drugs while pheL is only regulated in response to TMP and minC shows no response to either drug. (C) Scatterplot of ExTMP versus ExSPR (changes in expression at inhibition level indicated by light magenta bands in panels B, g=0.45-0.5, cf. red and blue arrows in B) for a genome-wide sample of promoters (Table S1). Promoters with regulatory conflicts (e.g. cspA, magenta), are located in the gray quadrants. Promoters that respond to only one of the drugs (e.g. pheL, magenta), are located near the horizontal and vertical dotted lines. Promoters showing the same qualitative response to both drugs (e.g. sodA, magenta), are located in the white quadrants. Note that many promoters show conflicts for this drug pair. (D) As C but for TET-SPR drug combination. Most promoters lie in the white quadrants, showing that conflicts occur less frequently for this drug pair. However, some promoters show conflicts (e.g. slp and dnaX, magenta). Error-bars in (B) correspond to two standard deviations estimated from replicate measurements done on different days (Experimental Procedures).
Figure 3
Figure 3. The gene regulation response to combinations of two antibiotics is largely explained by just two principal components
(A) Schematic of experimental procedure for measuring gene expression responses to combinations of two antibiotics. Two-dimensional drug concentration gradients were set up on 96-well plates (left). One promoter-GFP reporter strain was grown on each plate (middle). For each condition in the two drug space, the expression level Ex is obtained as in Figure 2, yielding the matrix of expression levels Ex of promoter X. (B) Examples for different types of gene expression responses in two-dimensional concentration gradients of TMP and SPR. Expression level Ex is shown in color code: Blue indicates down-regulation, red up-regulation, and white no change in gene expression. The promoter cspA shows a conflicting response, sodA a consistent response, minC no response, and pheL responds only to TMP (cf. Figure 2B,C). In these examples, the expression level in the drug combination lies between the levels in the individual drugs which is the case for most promoters. Responses of other promoters are shown in Figures S1 and S2. Drug concentrations are in units of the Minimal Inhibitory Concentration (MIC, see Table 1). (C) Principal Component Analysis (PCA) is performed on the expression level matrices Ex, yielding the principal components (PCs) EI, EII,…. The scores sx1,sx2, capture how strongly each PC contributes to the total response of promoter X (Experimental Procedures). Bar charts: Variance explained by the first five PCs for drug combination of TMP-SPR (left bar chart) and TET-SPR (right bar chart). Most variability is explained by the 1st PC, but the 2nd PC is also important. Almost the entire data set is explained by the first three PCs which thus capture the most typical features of the responses of all promoters.
Figure 4
Figure 4. The first principal component of the gene regulation response captures the effects of growth rate changes
(A) First Principal Component (PC) of gene expression response to two-drug environments TMP-SPR (top) and TET-SPR (bottom). Dashed line: line of constant growth rate (normalized growth rate g=0.5). White region in top right: No data due to low growth rates (Experimental Procedures). (B) Growth rate in two-drug environments TMP-SPR (top) and TET-SPR (bottom). Note similarity to corresponding 1st PC shown in B. (C) 1st PC along isobole g=0.5 (dashed line in A, B) as a function of the ‘effective drug fraction’ (see Experimental Procedures for formal definition). This PC is approximately constant along isoboles, showing that the first PC simply captures a generic transcriptional response to growth rate change, which is drug-independent.
Figure 5
Figure 5. Bacteria resolve gene regulatory conflicts by prioritizing their response to one of the drugs or by averaging the responses to the individual drugs
(A) 2nd PC of the global transcriptional response to TMP-SPR in color code (left panel). Blue indicates down-regulation, red up-regulation, and white no change in gene expression. Dashed black line: Growth rate isobole g=0.5. The 2nd PC shows a gene regulatory conflict and how it is resolved in the two-dimensional drug concentration space. Right panel: 2nd PC along growth rate isobole g=0.5. Note the nonlinear shape of the transition; dashed black curve, sigmoidal fit (Experimental Procedures). (B) As A but for TET-SPR. Note the linear shape of the transition in the right panel; dashed black curve, linear fit (Experimental Procedures). (C) Expression levels of genes dnaK, cspA, osmC, and dps in two-dimensional drug concentration space of TMP-SPR. Gene expression levels along the growth rate isobole (dashed black line, normalized growth rate g=0.5) are shown on the right. Magenta lines: sigmoidal fits (Experimental Procedures). Conflicts in gene expression are resolved in a prioritized response, leading to a relatively sharp transition between the conflicting expression levels as TMP is continuously replaced with SPR (cf. Figure 1B). (D) As B, but for different example genes ileX, dnaX, slp, and dps, which show conflicts in the two dimensional drug concentration space of TET-SPR. Magenta lines: linear fits (Experimental Procedures). Conflicts in gene expression are smoothly averaged, leading to a linear transition between the conflicting expression levels (cf. Figure 1B). (E) Inset: Schematic of sigmoidal fits to curves from (A,C) with fit parameter x0 characterizing the position of the transition between the two different gene expression responses. Histogram of fit results for x0 for drug combination of TMP-SPR (Experimental Procedures). The distribution of x0 is narrowly localized around 0.5 showing that the response of most genes is not biased towards either of the drugs (cf. Figure 1C) though a few genes are biased towards TMP (bars near x0=1). Error-bars correspond to two standard deviations estimated from replicate measurements done on different days (Experimental Procedures).
Figure 6
Figure 6. A few promoters show a specific response to the drug combination in which the expression level does not lie in between the two responses to the individual drugs
(A) Scatterplot of scores of the 3rd versus those of the 1st PC for TMP-SPR drug combination. While the 3rd PC contributes relatively little to the response of most promoters (cf. Figure 3C), it plays an important role for a few promoters (including lexA, slp, and glyA; highlighted in magenta). (B) 3rd PC in two-dimensional drug concentration space of TMP-SPR shown in color code. The 3rd PC has a clear peak in the drug combination. The few promoters which show higher or lower expression levels in response to the drug combination than in response to either of the individual drugs are captured by this component. (C,D) Promoters lexA (C) and slp (D) which have a relatively large 3rd PC score (A) indeed show lower (C) or higher (D) expression levels in the drug combination. For glyA, see Figure S5A.
Figure 7
Figure 7. Prioritized response coincides with increased cell-to-cell gene expression variability in the drug combination
(A) Top: GFP fluorescence from E. coli cells. In this example, GFP is driven by the cspA promoter. Magenta outlines show segmentation (Experimental Procedures). Bottom: Histogram of GFP intensities per cell in TMP alone (left), SPR alone (right) and the combination of TMP-SPR (middle). While the distributions of gene expression levels are unimodal in all conditions, a much wider distribution is observed when TMP and SPR are present simultaneously (blue arrows). (B) Population average measurements of expression level Ex (black circles) along growth rate isobole g = 0.5 as in Figure 5C, for promoters cspA, ileX, and glyA in TMP-SPR drug combination. Black lines are sigmoidal fits (cf. Figure 5) except for glyA where black line shows cubic spline. Blue circles show variation coefficient of GFP/cell along a similar growth rate isobole. The coefficient of variation (CV) is a measure of the relative cell-to-cell variability in gene expression and defined as the empirical standard deviation of GFP/cell (shown in A) divided by its mean (Experimental Procedures). Blue lines are cubic splines. Gene expression cell-to-cell variability peaks in drug combination near the point where a sharp transition between two different responses occurs. (C) As B but for TET-SPR showing promoters rpmE, ileX, and glyA which have regulatory conflicts in this drug combination. Note that gene expression cell-to-cell variability does not peak in the drug combination.

Comment in

References

    1. Alberts B. Molecular biology of the cell. 5. New York: Abingdon, Garland Science; 2008.
    1. Bliss CI. The toxicity of poisons applied jointly. Annals of Applied Biology. 1939;26:585–615.
    1. Bollenbach T, Quan S, Chait R, Kishony R. Nonoptimal microbial response to antibiotics underlies suppressive drug interactions. Cell. 2009;139:707–718. - PMC - PubMed
    1. Brauer MJ, Huttenhower C, Airoldi EM, Rosenstein R, Matese JC, Gresham D, Boer VM, Troyanskaya OG, Botstein D. Coordination of growth rate, cell cycle, stress response, and metabolic activity in yeast. Mol Biol Cell. 2008;19:352–367. - PMC - PubMed
    1. Brazas MD, Hancock RE. Using microarray gene signatures to elucidate mechanisms of antibiotic action and resistance. Drug Discov Today. 2005;10:1245–1252. - PubMed

Publication types

MeSH terms

Substances