. 2011 May 20;42(4):465-76.
doi: 10.1016/j.molcel.2011.03.028.

Multiple sequence-specific factors generate the nucleosome-depleted region on CLN2 promoter

Affiliations

Multiple sequence-specific factors generate the nucleosome-depleted region on CLN2 promoter

Lu Bai et al. Mol Cell. .

Abstract

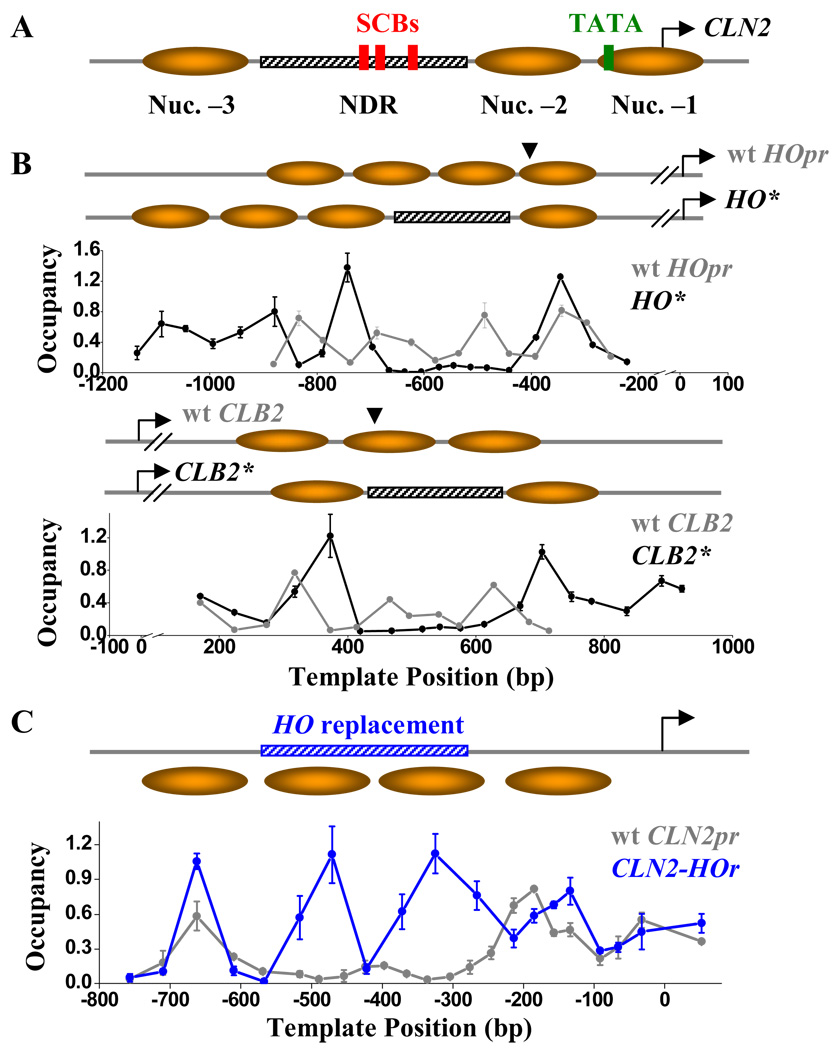
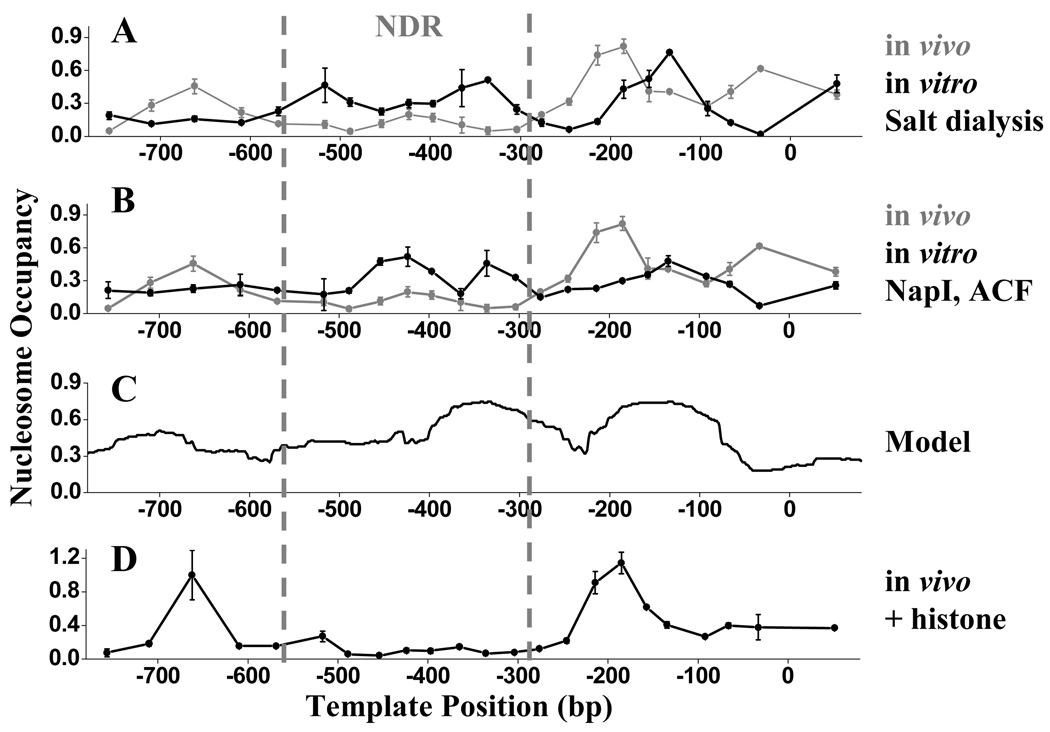
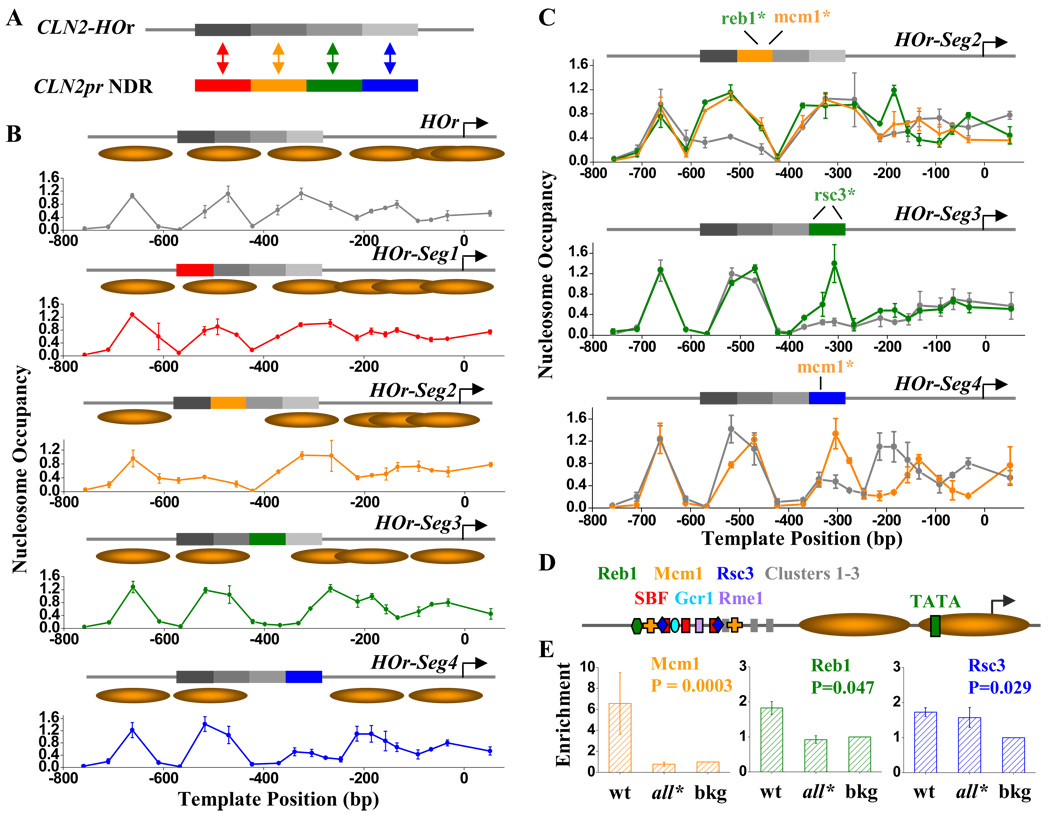
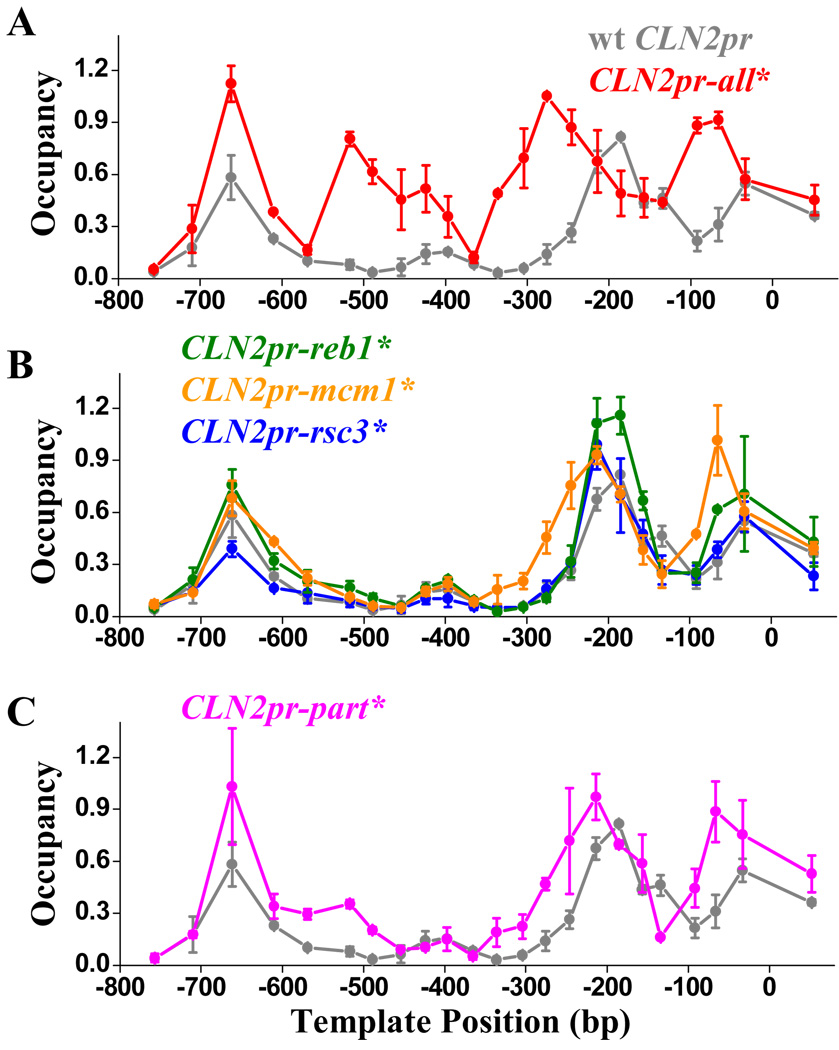
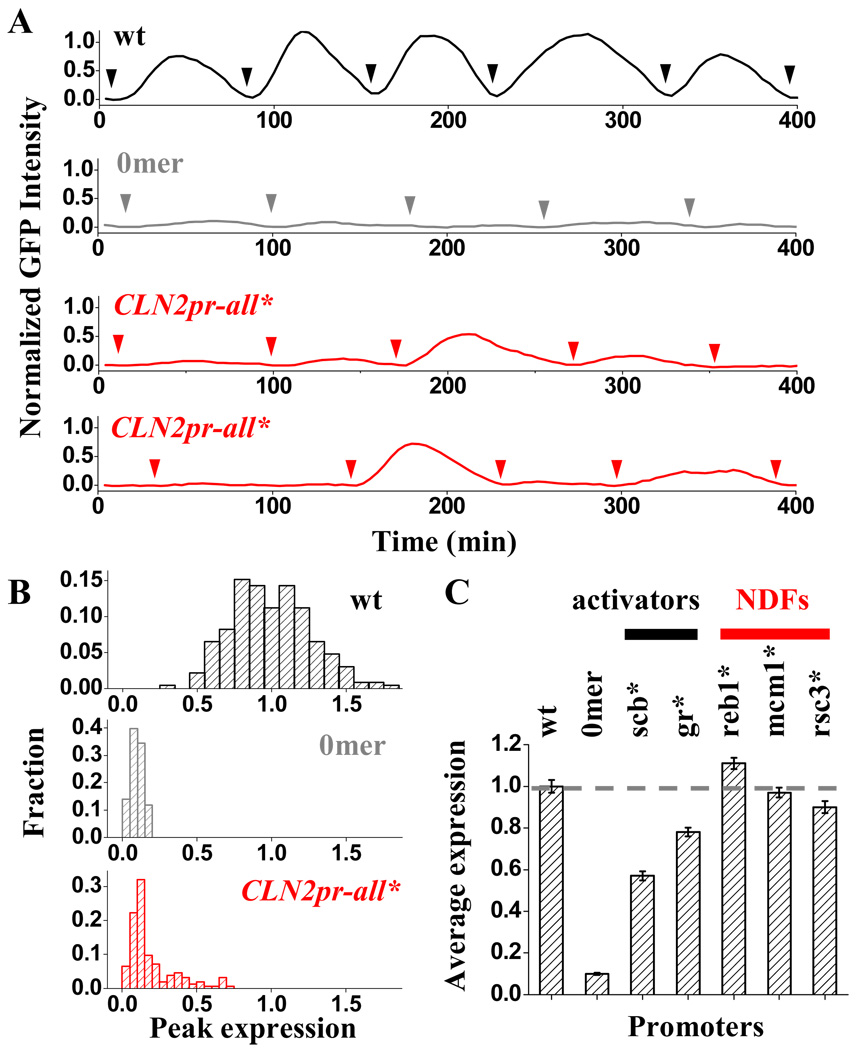
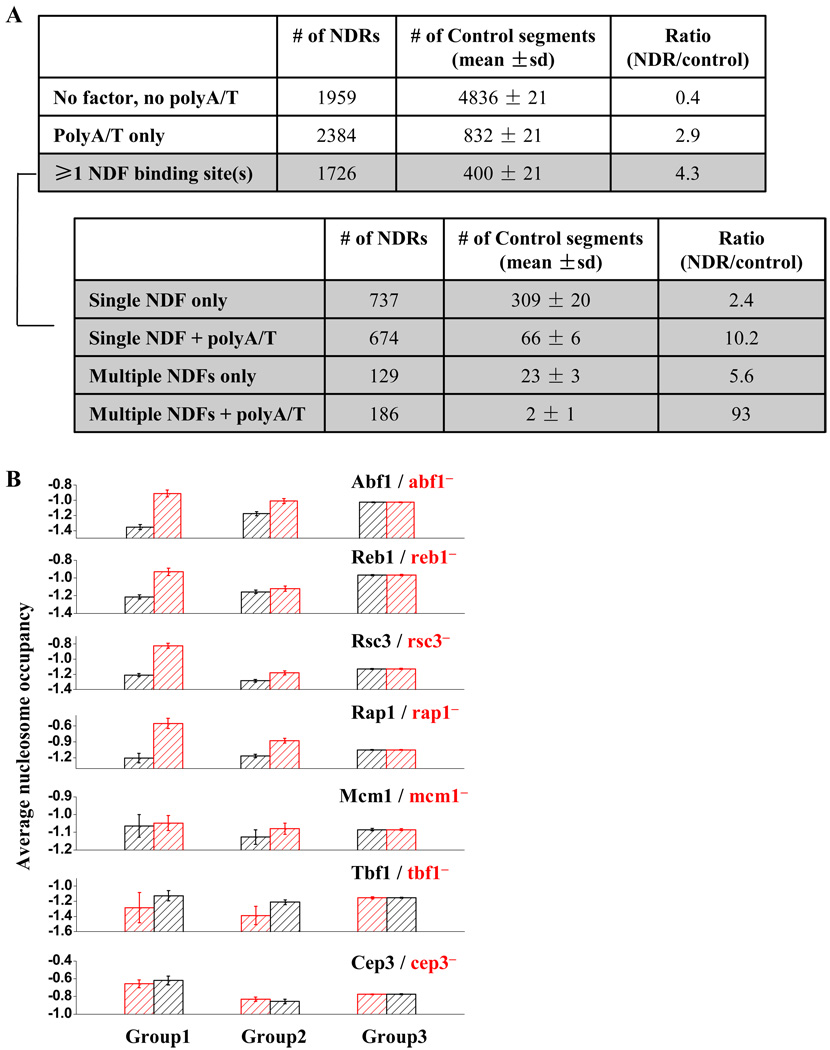
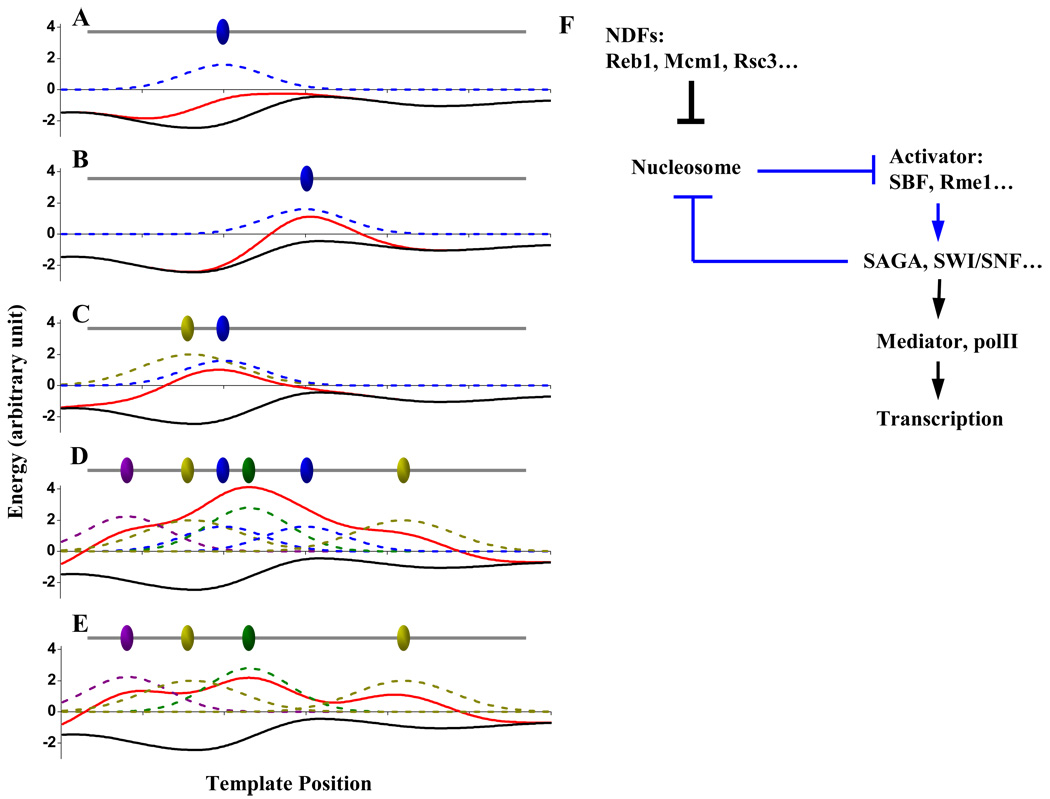
Nucleosome-depleted regions (NDRs) are ubiquitous on eukaryotic promoters. The formation of many NDRs cannot be readily explained by previously proposed mechanisms. Here, we carry out a focused study on a physiologically important NDR in the yeast CLN2 promoter (CLN2pr). We show that this NDR does not result from intrinsically unfavorable histone-DNA interaction. Instead, we identified eight conserved factor binding sites, including that of Reb1, Mcm1, and Rsc3, that cause the local nucleosome depletion. These nucleosome-depleting factors (NDFs) work redundantly, and simultaneously mutating all their binding sites eliminates CLN2pr NDR. The loss of the NDR induces unreliable "on/off" expression in individual cell cycles, but in the presence of the NDR, NDFs have little direct effect on transcription. We present bioinformatic evidence that the formation of many NDRs across the genome involves multiple NDFs. Our findings also provide significant insight into the composition and spatial organization of functional promoters.


Figures

Figure 1
Figure 1. CLN2pr NDR is a property of local DNA sequence
A) Genomic structure and nucleosome distribution on wt CLN2pr. The CLN2pr contains three well-positioned nucleosomes (shaded ovals) and NDR (hatched bar). The position of SCBs (red rectangles), TATA box (yellow rectangle) and TSS (arrow) are also shown. B) Nucleosome occupancy on the HO* (upper panel) and CLB2* (lower panel), as well as the inferred nucleosome positioning. HO* / CLB2* are constructed by inserting the CLN2pr NDR sequence into the HOpr / CLB2 ORF at the sites indicated by the arrows. The nucleosome occupancy on wt HOpr and CLB2 ORF are also shown in the corresponding panels. The position “0” on the plot represents the translation start site of HO and CLB2 gene. C) Nucleosome occupancy on the CLN2-HOr (blue curve) in comparison with that on the wt CLN2pr (gray). CLN2-HOr is a CLN2pr variant with the NDR replaced by a HOpr sequence (blue hatched bar). The position “0” on the plot represents the CLN2pr TSS (same for below).
Figure 2
Figure 2. Histone-DNA affinity is unlikely to be responsible for the CLN2pr NDR formation
A, B) In vivo (gray) and in vitro (black) nucleosome occupancy on the CLN2pr. The in vitro nucleosome assembly is carried out either by salt dialysis (A) or with purified NapI and ACF (B). C) Nucleosome occupancy on the CLN2pr predicted by a mathematical model from Kaplan et al. (2009). D) In vivo nucleosome occupancy on the CLN2pr in a strain with over-expressed histones.
Figure 3
Figure 3. Multiple sequence-specific factors are responsible for nucleosome-depletion on CLN2pr NDR
A) Construction of the HOr-Seg1–4 sequences. We divided the CLN2pr NDR sequence into 4 segments, each ~80 bp in length, and replaced them back into the CLN2-HOr (Figure 1C), one at a time. B) Nucleosome occupancy and inferred positioning on CLN2-HOr (repeated from Figure 1C) and HOr-Seg1–4 Seg2–4 each independently forms local NDRs. C) The measured nucleosome occupancy on the HOr-Seg2–4 sequences with mutated (colored curves) or wt Seg2–4 (gray curves). Mutations in the Reb1 or Mcm1 binding sites in the Seg2 (top panel), the two Rsc3 binding sites on Seg3 (middle panel), and the Mcm1 binding site on Seg4 (bottom panel), eliminates the local NDR. See Table S1 for detailed sequence / factor binding sites / mutation information. D) Summary for all the potential factor binding sites on CLN2pr NDR. The binding sites listed on the top row, but not the bottom row, contribute to the NDR formation. Cluster 1–3 represent three conserved sequence elements on Seg4 that lower the local nucleosome density, but the bound factors are yet to be identified (see text for details). E) ChIP measurement of the enrichment of Reb1, Mcm1 and Rsc3 on the wt CLN2pr and CLN2pr-all* (CLN2pr with mutations in the binding sites of Reb1, Mcm1, Rsc3 and Cluster 1–3). The enrichment is normalized to the background level (bkg). The binding of all three factors to the wt CLN2pr are significantly above the bkg (P value shown in panels), whereas Reb1 and Mcm1 binding to the CLN2pr-all* are eliminated.
Figure 4
Figure 4. The NDR formation in the context of wt CLN2pr
A–C) The measured nucleosome occupancy on the CLN2pr-all* (reb1* + mcm1* + rsc3* + cluster 1–3*) (A), CLN2pr-reb1*, -mcm1*, -rsc3* (B) and CLN2pr-part* (reb1* + mcm1* + cluster 1–3*) (C) vs. that on wt CLN2pr (gray curves in A–C). Simultaneous mutations in the Reb1, Mcm1, Rsc3 binding sites and Clusters 1–3 eliminates NDR (CLN2pr-all*); mutations in a subset of the binding sites either have no apparent effect on CLN2pr NDR (CLN2pr-reb1* and -rsc3*), or mildly shrink the NDR (CLN2pr-mcm1* and -part*).
Figure 5
Figure 5. Transcriptional activity of CLN2pr-all* and other CLN2pr mutants
A) Example traces of GFP expression driven by wt CLN2pr (black), CLN2pr-del (gray) and CLN2pr-all* (red). Each trace represents the GFP intensity as a function of time in a single yeast cell over multiple cell generations. The arrows indicate the time points of cell division. In the case of CLN2pr-all*, two traces of the GFP measurements are shown. B) Histogram of the peak expression per cell cycle for the wt, CLN2pr-del and CLN2pr-all*. The wt CLN2pr is “on”, and the CLN2pr-del is “off” every cell cycle. In contrast, CLN2pr-all* switches between “on” and “off” cycles with a ~20% “on” probability. C) Normalized average expression levels of CLN2pr variants with only a subset of binding site(s) mutated. gr* represents the mutation in Gcr1 and Rme1 binding sites. Based on the functions of the factors in transcriptional activation vs. NDR formation, we can separate them into two categories: activator vs. nucleosome depleting factors (NDFs).
Figure 6
Figure 6. Genome-wide analyses for NDR formation
A) The number of NDRs that contain NDF consensus site(s) and / or PolyA/T, in comparison with the non-NDR control. The ~1700 NDRs containing at least one NDF binding sites are further dissected based on the number of NDF binding sites as well as the presence of PolyA/T. B) For each NDF (factor A; including Abf1, Reb1, Rap1, Rsc3 and Mcm1), the genome-wide NDRs are divided into three groups based on their sequences. Group1: factor A only, Group2: factor A + other nucleosome-repelling elements, Group3: no factor A. The average nucleosome occupancy of NDRs in these three groups are plotted before (black) and after (red) the deletion of factor A. NDRs in Group2 tends to be more “resistant” upon factor A deletion. For comparison, similar test is applied to factors with little or no nucleosome-depleting activity, including Tbf1 and Cep3. Data size (# of NDRs in Group1–3 for each factor): Abf1: 157, 187, 5725; Reb1:238, 287, 5544; Rsc3: 346, 511, 5212; Rap1: 15, 85, 5969; Mcm1: 29, 76, 5964; Tbf1: 41, 133, 5895; Cep3: 83, 207, 5779).
Figure 7
Figure 7. Models for NDR formation and transcription activation of CLN2pr
A–E) Simple energetic model for the formation of NDR. Ovals: bound factors on the DNA. Black curves: basal energy landscape for the nucleosome assembly on naked DNA. Blue, yellow, green and purple dashed curves: local energy penalties against nucleosome assembly generated by the factors. Red curves: the overall energy landscape. When the red curve goes above 0, nucleosome assembly becomes energetically unfavorable and NDR will form. See text for details. F) Reaction pathway for transcription activation on CLN2pr. See text for details.

References

    1. Adkins MW, Howar SR, Tyler JK. Chromatin disassembly mediated by the histone chaperone Asf1 is essential for transcriptional activation of the yeast PHO5 and PHO8 genes. Mol Cell. 2004;14:657–666. - PubMed
    1. Albert I, Mavrich TN, Tomsho LP, Qi J, Zanton SJ, Schuster SC, Pugh BF. Translational and rotational settings of H2A.Z nucleosomes across the Saccharomyces cerevisiae genome. Nature. 2007;446:572–576. - PubMed
    1. Badis G, Chan ET, van Bakel H, Pena-Castillo L, Tillo D, Tsui K, Carlson CD, Gossett AJ, Hasinoff MJ, Warren CL, et al. A library of yeast transcription factor motifs reveals a widespread function for Rsc3 in targeting nucleosome exclusion at promoters. Mol Cell. 2008;32:878–887. - PMC - PubMed
    1. Bai L, Charvin G, Siggia ED, Cross FR. Nucleosome-depleted regions in cell-cycle-regulated promoters ensure reliable gene expression in every cell cycle. Dev Cell. 18:544–555. - PMC - PubMed
    1. Bean JM, Siggia ED, Cross FR. High functional overlap between MluI cell-cycle box binding factor and Swi4/6 cell-cycle box binding factor in the G1/S transcriptional program in Saccharomyces cerevisiae. Genetics. 2005;171:49–61. - PMC - PubMed

Publication types

MeSH terms

LinkOut - more resources