. 2011 May 20;42(4):500-10.
doi: 10.1016/j.molcel.2011.04.018.

Identification of a microRNA that activates gene expression by repressing nonsense-mediated RNA decay

Affiliations

Identification of a microRNA that activates gene expression by repressing nonsense-mediated RNA decay

Ivone G Bruno et al. Mol Cell. .

Abstract

Nonsense-mediated decay (NMD) degrades both normal and aberrant transcripts harboring stop codons in particular contexts. Mutations that perturb NMD cause neurological disorders in humans, suggesting that NMD has roles in the brain. Here, we identify a brain-specific microRNA-miR-128-that represses NMD and thereby controls batteries of transcripts in neural cells. miR-128 represses NMD by targeting the RNA helicase UPF1 and the exon-junction complex core component MLN51. The ability of miR-128 to regulate NMD is a conserved response occurring in frogs, chickens, and mammals. miR-128 levels are dramatically increased in differentiating neuronal cells and during brain development, leading to repressed NMD and upregulation of mRNAs normally targeted for decay by NMD; overrepresented are those encoding proteins controlling neuron development and function. Together, these results suggest the existence of a conserved RNA circuit linking the microRNA and NMD pathways that induces cell type-specific transcripts during development.


Figures

Figure 1
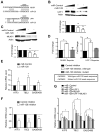
Figure 1. miR-128 Regulates NMD
(A) Predicted base pairing of mature miR-128 seed sequences in the 3′ UTRs of MLN51 and UPF1 (http://www.targetscan.org). (B, C) Western blot analysis of endogenous UPF1 and MLN51 protein levels in HEK293 cells 24 h after transfection with a mature miR-128 mimic or a random negative-control miRNA mimic (Ambion/ABI, Inc.). β-actin is the internal control. Bottom panels show the mean of three experiments; error bars represent standard deviation (SD). (D) Luciferase expression in HeLa cells transfected for 24 h with firefly luciferase pmiR (Ambion/ABI, Inc.) reporters containing MLN51 or UPF1 3′ UTR sequences, including the putative miR-128 target sites shown in panel A. The mutants have the indicated 2-nt mutation in the target sequence. The cells were cotransfected with a miR-128-specific inhibitor or a negative-control inhibitor (Ambion/ABI, Inc.). A Renilla luciferase construct was co-transfected to control for transfection efficiency. (E, F) Quantitative polymerase chain reaction (qPCR) analysis of HeLa cells transfected for 24 h with the indicated miRNA mimics (panel E) or LNA inhibitor (Exiqon, Inc; panel F). Shown are the results from three independent experiments, normalized to GAPDH mRNA levels. (G) qPCR analysis of HEK293 cells transfected with the miR-128 or control mimic in combination with UPF1, MLN51, and/or empty expression plasmids. Quantification was conducted as in panel E. For all panels, error bars indicate standard deviation. Asterisks and symbol (ζ) denote statistically significant differences; P < 0.05 (paired Student’s t-test).
Figure 2
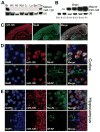
Figure 2. The miR-128/NMD Regulatory Circuit Is Conserved
(A) miR-128-1/-2 and its conserved targets in the UPF1 and MLN51 3′ UTRs; human (Hsa), mouse (Mmu), chicken (Gga), and frog (Xla). (B) miR-128 levels in chick neural tubes assessed by Taqman-qPCR analysis. Exogenous miR-128 (40 μM miR-128 mimic, Ambion Inc.) was electroporated 60 hours after fertilization and RNA was harvested 84 h after fertilization (n=3). miR-128 levels were normalized to U6 snRNA. (C) qPCR analysis of the indicated transcripts in chick neural tube electroporated with the miR-128 or control miRNA mimic and harvested as described in panel B. (D) miR-128 levels in X. laevis embryos assessed by Taqman-qPCR analysis. Exogenous miR-128 (5 pmoles of miR-128 mimic, Ambion Inc.) was injected into two-cell embryos and RNA was prepared at the time points indicated (n=5). miR-128 levels were normalized to L19 RNA. (E) qPCR analysis of the indicated transcripts from stage (st) 10.5 embryos injected as described in panel D. TIAR and DKK1 transcripts are putative NMD substrates, based on their having NMD-inducing features (http://www.ncbi.nlm.nih.gov). For all panels, experiments were performed in triplicate, error bars indicate standard deviation, and asterisks indicate statistically significant differences (P<0.05; paired Student’s t-test).
Figure 3
Figure 3. miR-128 is a Brain-Enriched, Developmentally Regulated, Neuron-Specific miRNA
(A) Northern blot analysis of adult mouse tissues. U6 small nuclear RNA (snRNA) is the loading control. Brain (Br), heart (Ht), Intestine (Int), liver (Li), lung (Lu), spleen (Spl), and thymus (Thy). (B) Northern blot analysis of mouse brains from the indicated embryonic (E) and postnatal (P) time points. U6 snRNA is the loading control. (C) miR-128 LNA in situ hybridization followed by immunofluorescence analysis of the neuronal marker NeuN in a section of adult mouse brain containing the cerebral cortex and hippocampus (low magnification view). (D, E) miR-128 LNA in situ hybridization followed by immunofluorescence analysis of adult cerebral cortex (D) and hippocampus (E) (both high magnification views). DAPI staining indicates location of cell nuclei (note the distinct glial cell morphologies revealed by GFAP staining).
Figure 4
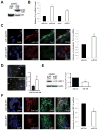
Figure 4. miR-128 Promotes a Neural Differentiation Phenotype and Inhibits UPF1 Expression in Neural Stem Cells
(A) Northern blot analysis of mouse NSCs grown as neurospheres for 3 days under proliferating conditions and transfected with either the miR-128 mimic (miR-128) or control miRNA mimic (miR-Ctrl) (Ambion/ABI, Inc.). Shown is mature miR-128; U6 snRNA is the loading control. (B) qPCR analysis of NSCs grown as described in panel A and transfected with miR-128 mimic, miR-Control, a siRNA specific for UPF1 (siUPF1), or luciferase siRNA (siLUC) as a negative control. Tuj-1 mRNA levels were normalized against L19 mRNA. (C) Deconvolution microscopic analyses of TUJ-1 protein level in NSCs grown as described in panel A, infected with either miR-128-RFP- or miR-Ctrl-RFP-lentivirus, and cultured for 3 days. The images on the top left are of miR-128-RFP-lentivirus-infected cells; arrows mark the two cells expressing miR-128; the images on the bottom left are of miR-Ctrl-RFP-lentivirus-infected cells. DAPI staining shows location of all cell nuclei. The relative values shown on the right were determined using colocalization software and are the mean of three independent experiments. The intensity of colocalization of TUJ-1 and the miR-Ctrl is arbitrarily set to a value of 1. (D) Mouse NSCs grown under adherent conditions were cotransfected with a GFP expression plasmid and either the miR-128 mimic or miR-Ctrl, followed by culture for 24 h. The graph shows the quantification of dendritic length in GFP-positive cells determined using ImageJ software. (E) Left: Western blot analysis of endogenous UPF1 protein levels in mouse NSCs cultured and transfected as described in panel A. Right: quantification of 3 independent experiments using β-actin as a normalization control. (F) Deconvolution microscopic analyses of UPF1 protein level in NSCs cultured, infected, and analyzed as described in panel C. For all panels, error bars represent standard deviation and asterisks indicate statistically significant differences (P<0.05; paired Student’s t-test).
Figure 5
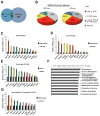
Figure 5. miR-128 Elicits Widespread Upregulation of Neural-Related Transcripts in Neural Stem Cells
(A) VENN diagram of transcripts significantly upregulated (up) (p<0.05) in response to miR-128 in NSCs cultured and transfected as described in Figure 4A. The transcripts were identified using the Affymetrix mouse 1.0 ST exon array, which covers most of the known exons in 17,000 mouse protein-coding genes. Differentially expressed transcripts (DETs) and alternative isoform transcripts (AITs) are defined in the text. (B) NMD-inducing features in the 100 most upregulated DETs and AITs, as determined using the SpliceMiner program: http://www.tigerteamconsulting.com/SpliceMiner/. (C, D) Verification of DETs and AITs by qPCR analysis, performed on NSCs cultured and transfected as in panel A. mRNA levels were normalized to L19 RNA levels. The colors of the bars represent the known NMD-inducing feature of each transcript (see panel B). (E) qPCR analysis of NSCs cultured as described in panel C and transfected with a siRNA specific for UPF1 (siUPF1) to inhibit NMD or a Luciferase siRNA (siLUC) as a negative control. Quantification and bar colors are as in panel C. We tested all transcripts in panels C and D for responsiveness to UPF1 knockdown; all those not shown in panel E were not statistically upregulated (p<0.05). (F) Gene ontology (GO) processes most statistically overrepresented in DETs upregulated in response to forced miR-128 expression in NSCs, as identified using MetaCore software (GeneGo, San Diego, CA). (G) Validation of selected transcripts in the neuronal GO categories “neurogenesis,” “neuron differentiation,” and “neuron projection morphogenesis.” qPCR analysis was performed on total cellular RNA from NSCs treated as described in panel C. Quantification and bar colors are as in panel C. For all panels, experiments were performed in triplicate and error bars represent standard deviation. All transcripts shown in panels C, D, E, and G were significantly upregulated compared to controls (P<0.05; paired Student’s t-test).
Figure 6
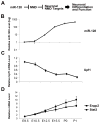
Figure 6. The Dramatic Upregulation of miR-128 During Brain Development is Accompanied by Upregulation of NMD Substrates
(A) Model. (B–D) qPCR analysis of pooled mouse brains from the indicated embryonic (E) and postnatal (P) time points. Mature miR-128 levels (B) were determined by Taqman-qPCR analysis and normalized against U6 snRNA levels. Upf1 mRNA (C) and NMD substrate (D) mRNA levels were determined using qPCR analysis and normalized against L19 mRNA levels. Error bars represent standard deviation.

Comment in

Similar articles

Cited by

References

    1. Abu-Elneel K, Liu T, Gazzaniga FS, Nishimura Y, Wall DP, Geschwind DH, Lao K, Kosik KS. Heterogeneous dysregulation of microRNAs across the autism spectrum. Neurogenetics. 2008;9:153–161. - PubMed
    1. Addington AM, Gauthier J, Piton A, Hamdan FF, Raymond A, Gogtay N, Miller R, Tossell J, Bakalar J, Germain G, et al. A novel frameshift mutation in UPF3B identified in brothers affected with childhood onset schizophrenia and autism spectrum disorders. Mol Psychiatry 2010 - PMC - PubMed
    1. Anastasaki C, Longman D, Capper A, Patton EE, Caceres JF. Dhx34 and Nbas function in the NMD pathway and are required for embryonic development in zebrafish. Nucleic Acids Res 2011 - PMC - PubMed
    1. Bak M, Silahtaroglu A, Moller M, Christensen M, Rath MF, Skryabin B, Tommerup N, Kauppinen S. MicroRNA expression in the adult mouse central nervous system. RNA. 2008;14:432–444. - PMC - PubMed
    1. Bartel DP. MicroRNAs: target recognition and regulatory functions. Cell. 2009;136:215–233. - PMC - PubMed

Publication types

MeSH terms