

Quantification of regional interstitial lung disease from CT-derived fractional tissue volume: a lung tissue research consortium study
- PMID: 21596593
- PMCID: PMC3128646
- DOI: 10.1016/j.acra.2011.03.004
Quantification of regional interstitial lung disease from CT-derived fractional tissue volume: a lung tissue research consortium study
Abstract
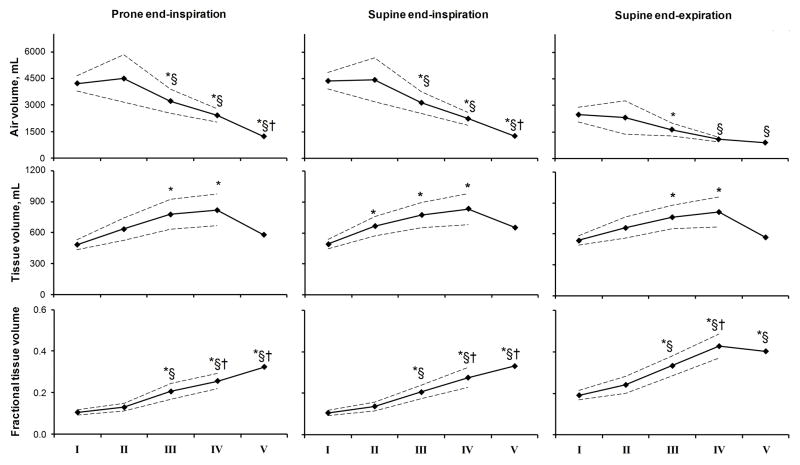
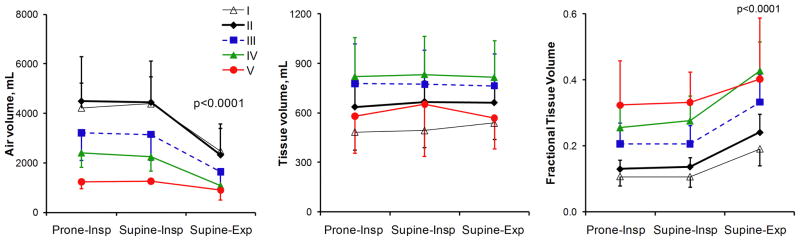
Rationale and objectives: Evaluation of chest computed tomography (CT) is usually qualitative or semiquantitative, resulting in subjective descriptions often by different observers over time and imprecise determinations of disease severity within distorted lobes. There is a need for standardized imaging biomarkers to quantify regional disease, maximize diagnostic yield, and facilitate multicenter comparisons. We applied lobe-based voxelwise image analysis to derive regional air (Vair) and tissue (Vtissue) volumes and fractional tissue volume (FTV = tissue/[tissue+air] volume) as internally standardized parameter for assessing interstitial lung disease (ILD).
Materials and methods: High-resolution CT was obtained at supine and prone end-inspiration and supine end-expiration in 29 patients with ILD and 20 normal subjects. Lobar Vair, Vtissue, and FTV were expressed along standard coordinate axes.
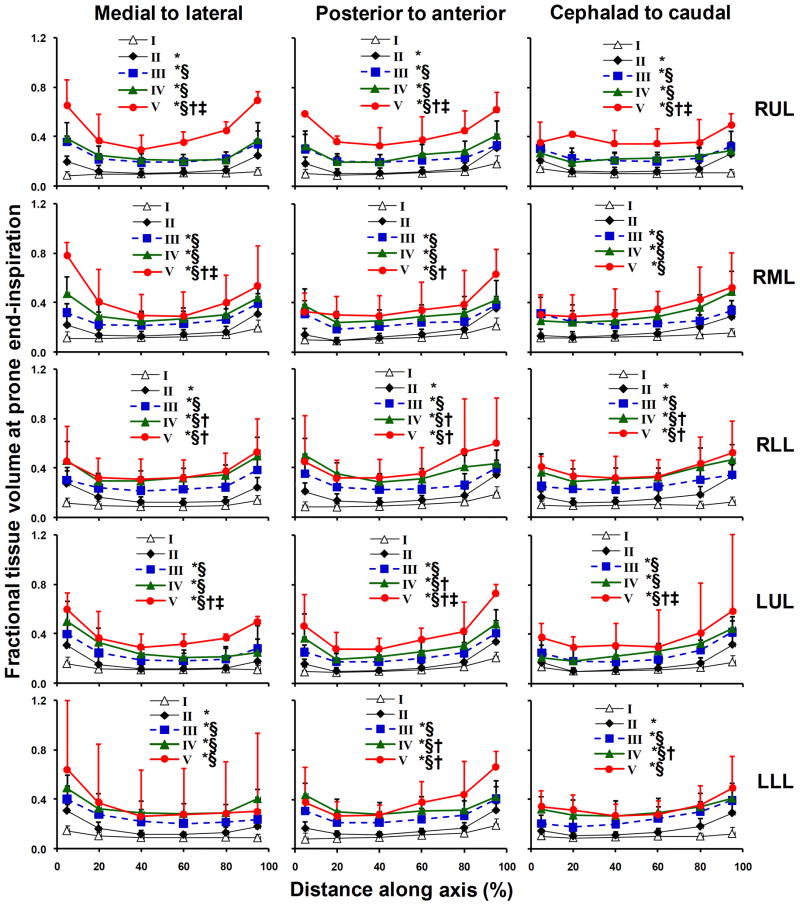
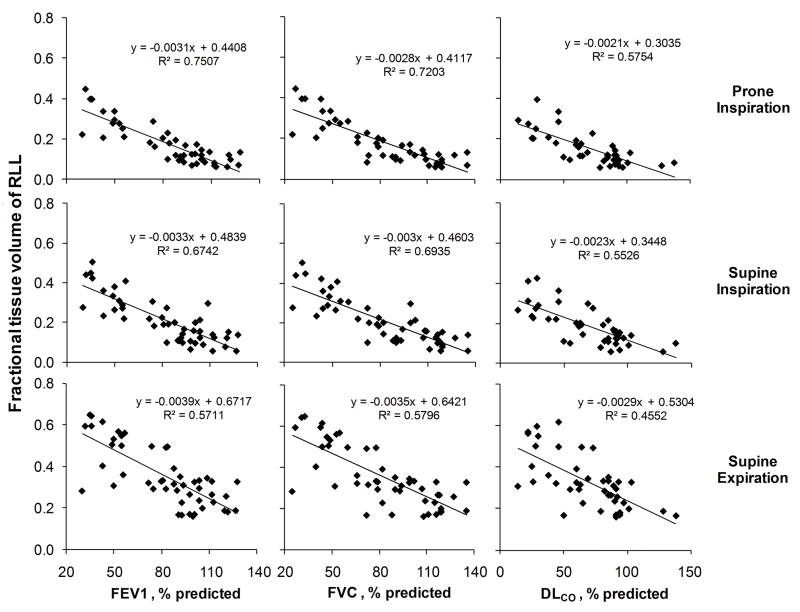
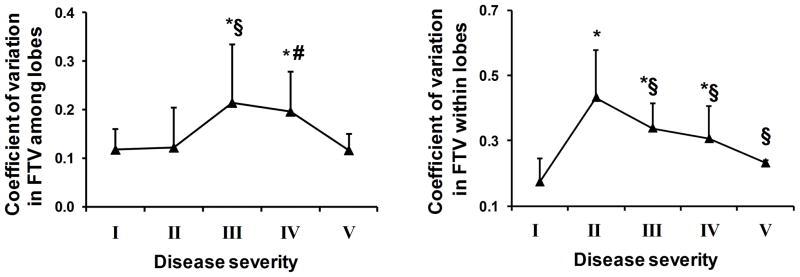
Results: In normal subjects from end-inspiration to end-expiration, total Vair declined ~43%, FTV increased ~80%, but Vtissue remained unchanged. With increasing ILD, Vair declined and Vtissue rose in all lobes; FTV increased with a peripheral-to-central progression inversely correlated to spirometry and lung diffusing capacity (r(2) = 0.57-0.75, prone end-inspiration). Inter- and intralobar coefficients of variation of FTV increased 84-148% in mild-to-moderate ILD, indicating greater spatial heterogeneity, then normalized in severe ILD. Analysis of discontinuous images incurs <3% error compared to consecutive images.
Conclusions: These regional attenuation-based biomarkers could quantify heterogeneous parenchymal disease in distorted lobes, detect mild ILD involvement in all lobes and describe the pattern of disease progression. The next step would be to study a larger series, examine reproducibility and follow longitudinal changes in correlation with clinical and functional indices.
Copyright © 2011 AUR. Published by Elsevier Inc. All rights reserved.
Figures


References
-
- Aziz ZA, Wells AU, Bateman ED, Copley SJ, Desai SR, Grutters JC, Milne DG, Phillips GD, Smallwood D, Wiggins J, et al. Interstitial lung disease: effects of thin-section CT on clinical decision making. Radiology. 2006;238:725–733. - PubMed
-
- Smith-Bindman R. Is computed tomography safe? N Engl J Med. 2010;363:1–4. - PubMed
-
- Goldin JG, Lynch DA, Strollo DC, Suh RD, Schraufnagel DE, Clements PJ, Elashoff RM, Furst DE, Vasunilashorn S, McNitt-Gray MF, et al. High-resolution CT scan findings in patients with symptomatic scleroderma-related interstitial lung disease. Chest. 2008;134:358–367. - PubMed
-
- Zompatori M, Bna C, Poletti V, Spaggiari E, Ormitti F, Calabro E, Tognini G, Sverzellati N. Diagnostic imaging of diffuse infiltrative disease of the lung. Respiration. 2004;71:4–19. - PubMed
-
- Li F, Kumazawa S, Shiraishi J, Li Q, Engelmann R, Caligiuri P, MacMahon H, Doi K. Subjective similarity of patterns of diffuse interstitial lung disease on thin-section CT: an observer performance study. Acad Radiol. 2009;16:477–485. - PubMed
