. 2011 Sep 1;39(16):6998-7008.
doi: 10.1093/nar/gkr371. Epub 2011 May 19.

Phosphorylation of Mcm2 modulates Mcm2-7 activity and affects the cell's response to DNA damage

Affiliations

Phosphorylation of Mcm2 modulates Mcm2-7 activity and affects the cell's response to DNA damage

Brent E Stead et al. Nucleic Acids Res. .

Abstract

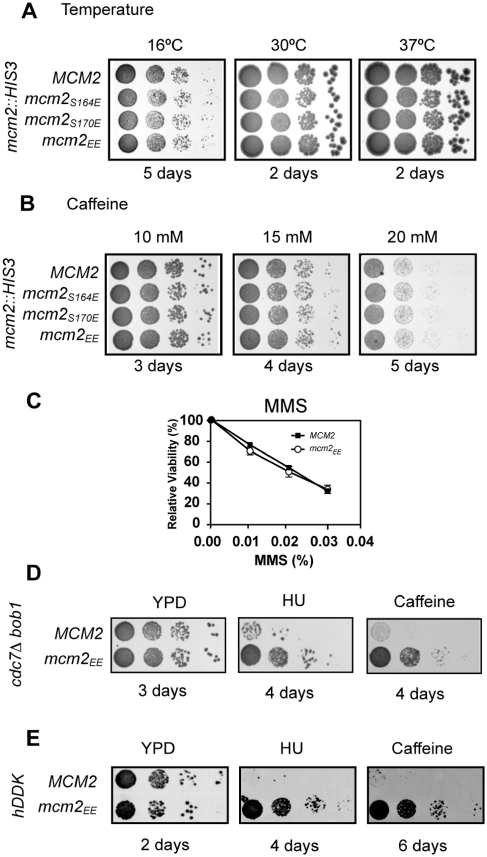
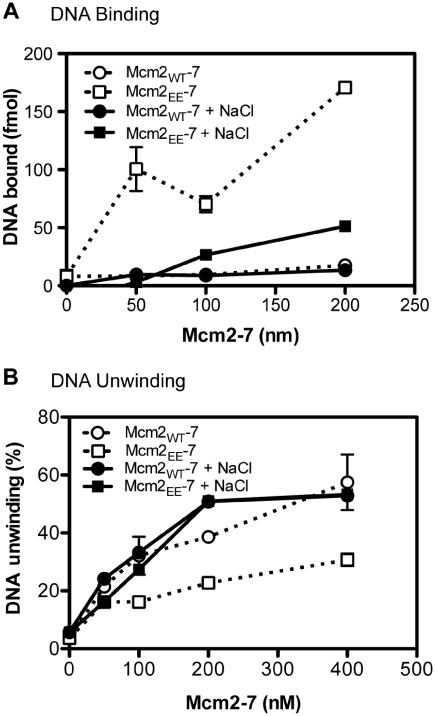
The S-phase kinase, DDK controls DNA replication through phosphorylation of the replicative helicase, Mcm2-7. We show that phosphorylation of Mcm2 at S164 and S170 is not essential for viability. However, the relevance of Mcm2 phosphorylation is demonstrated by the sensitivity of a strain containing alanine at these positions (mcm2(AA)) to methyl methanesulfonate (MMS) and caffeine. Consistent with a role for Mcm2 phosphorylation in response to DNA damage, the mcm2(AA) strain accumulates more RPA foci than wild type. An allele with the phosphomimetic mutations S164E and S170E (mcm2(EE)) suppresses the MMS and caffeine sensitivity caused by deficiencies in DDK function. In vitro, phosphorylation of Mcm2 or Mcm2(EE) reduces the helicase activity of Mcm2-7 while increasing DNA binding. The reduced helicase activity likely results from the increased DNA binding since relaxing DNA binding with salt restores helicase activity. The finding that the ATP site mutant mcm2(K549R) has higher DNA binding and less ATPase than mcm2(EE), but like mcm2(AA) results in drug sensitivity, supports a model whereby a specific range of Mcm2-7 activity is required in response to MMS and caffeine. We propose that phosphorylation of Mcm2 fine-tunes the activity of Mcm2-7, which in turn modulates DNA replication in response to DNA damage.


Figures

Figure 1.
Figure 1.
Strains containing mutations in the Mcm2 phosphorylation sites are viable. (A) The growth of haploid mcm2Δ strains bearing plasmid-encoded MCM2 (WT), mcm2S164A, mcm2S170A or mcm2AA was compared. Serial 10-fold dilutions of the strains were spotted on YPD plates and grown at the indicated temperatures. (B) FACS of MCM2 and mcm2AA strains was performed on asynchronously growing cultures. (C) MCM2 and mcm2AA cells were treated with α-factor mating pheromone for 3 h at 30°C, washed and resuspended in YPD. The DNA content of an aliquot of fixed cells was analyzed by FACS while arrested and at the indicated times after release.
Figure 2.
Figure 2.
Sensitivity of mcm2AA to genotoxic agents. (A) The survival of MCM2 and mcm2AA strains after a 4-h exposure to the indicated concentration of HU or MMS relative to untreated cells was measured as described (37). The assay was performed in triplicate and plotted as mean percent survival ± standard error of the mean (SEM). (B) Serial 10-fold dilutions of strains containing wild-type MCM2, mcm2S164A, mcm2S170A or mcm2AA were spotted on YPD plates containing 10, 15 or 20 mM caffeine and grown at 30°C. (C) Serial 10-fold dilutions of MCM2 and mcm2AA were spotted on YPD and YPD containing 10 µg/ml calcofluor white (‘CW’) before incubation at 30°C.
Figure 3.
Figure 3.
Mcm2 phosphomimetic mutants. (A) The growth of haploid mcm2Δ strains bearing plasmids encoding MCM2, mcm2S164E, mcm2S170E or mcm2EE was compared. Serial 10-fold dilutions were spotted on YPD plates and grown for 3–5 days at 16, 30 or 37°C. (B) Serial 10-fold dilutions of the indicated strains were spotted on YPD media containing 10, 15 or 20 mM caffeine and grown at 30°C. (C) The survival of MCM2 and mcm2EEstrains after a 4 hour exposure to the indicated concentrations of MMS relative to untreated cells was measured as described (37). (D) Ten-fold serial dilutions of haploid cdc7Δ bob1 strains with wild type MCM2 or mcm2EE were spotted on YPD with and without HU (100 mM) or caffeine (10 mM) and incubated at 30°C. (E) A strain deleted at cdc7 and dbf4 and supported for growth with human CDC7 and DBF4 was transformed with plasmids encoding MCM2 or mcm2EE. Ten-fold serial dilutions of the strains were spotted on YPD with or without 150 mM HU or 15 mM caffeine and incubated at 30°C for 2–6 days.
Figure 4.
Figure 4.
Fluorescence microscopy of MCM2, mcm2AA and mcm2EE cells expressing GFP-tagged Rpa1. (A) MCM2, mcm2AA, mcm2EE and mec2-1 (53) strains were transformed with a plasmid expressing GFP-Rpa1. Representative bright field (‘BF’) and fluorescent (‘GFP’) images of cells from cultures grown at 30°C in YPD or YPD containing 0.03% MMS for 4 h are shown. The white arrowheads indicate foci. Images were taken on a Nikon Ti microscope at 400X. (B) The mean percent of cells with RPA foci was calculated by counting >100 cells in three replicate experiments. Strains in which the numbers of cells with RPA foci are significantly different (calculated by ANOVA with Tukey’s Multiple Comparison Test) from the MCM2 strain without MMS (*P < 0.05) and with MMS (**P < 0.05) are indicated.
Figure 5.
Figure 5.
Reconstitution of Mcm2WT-7 and Mcm2EE–7 complexes. (A) Mcm2–7 complexes containing wild-type Mcm2 (‘Mcm2WT–7′) or Mcm2EE (‘Mcm2EE–7′) were reconstituted from individual subunits. Shown are Coomassie Blue-stained sodium dodecyl sulfate (SDS) polyacrylamide (6%) gels of the fractions from the final gel filtration step. The elution of molecular size standards from the column is indicated above the gels. The migration of molecular size markers and of Mcms through the gels is indicated on the left and right, respectively. (B) DNA unwinding by Mcm2WT–7 and Mcm2EE–7 on synthetic fork substrates was examined. The peak fraction from each reconstitution was assayed for DNA unwinding. ‘Unwound’ is a control that indicates the extent of reannealing of unwound substrate. The migrations of double-stranded substrate and single-stranded product are indicated on the right. (C) The mean extent of DNA unwinding ± SEM by the indicated amount of each complex was calculated from three replicate experiments. (D) DNA unwinding by Mcm2WT–7 (200 nM) after treatment with DDK is shown. The extent of unwinding is indicated below the gel.
Figure 6.
Figure 6.
ssDNA binding by Mcm2–7. (A) DNA binding was measured using a gel filtration-based assay (6). Binding of Mcm2WT–7 (open triangle), Mcm2EE–7 (filled square) and Mcm2KR–7 (open circle) was determined in triplicate experiments and the mean plotted. Representative elution profiles for each point are shown in Supplementary Figure S3. (B) Mcm2–7 (200 fmol) was incubated in assay buffer with 100 µM ATP with or without DDK for 30 min at 30°C before addition of 50 fmol ssDNA and ATP to 5 mM. After incubation for 10 min at 37°C, the samples were analyzed by gel filtration. The mean amount of Mcm2–7 that co-eluted with DNA in triplicate experiments was determined. (C) A Phosphor screen image of a representative EMSA. The migration of free DNA and protein–DNA complex is indicated on the left. A portion of a gel containing free protein and protein–DNA complex was removed and stained with GelCode Blue (Pierce) and is shown on the right. (D) The mean amount of DNA shifted was calculated and plotted with SEM from three replicate experiments.
Figure 7.
Figure 7.
Disruption of DNA binding rescues the DNA unwinding defect of Mcm2EE–7. (A) DNA binding by the indicated concentrations of Mcm2WT–7 (black circle) and Mcm2EE–7 (black square) in the presence of 100 mM NaCl was measured by EMSA and plotted. DNA binding by Mcm2WT–7 (white circle) and Mcm2EE–7 (white square) in the absence of NaCl is shown for comparison. (B) DNA unwinding by the indicated concentrations of Mcm2WT–7 (black circle) and Mcm2EE–7 (black square) in the presence of 100 mM NaCl was measured. DNA unwinding by Mcm2WT–7 (white circle) and Mcm2EE–7 (white square) in the absence of NaCl is shown for comparison.
Figure 8.
Figure 8.
Phosphomimetic mutations in Mcm2 reduce ATP hydrolysis. (A) A schematic showing the Mcm2/6 subunit interface. The phosphate binding loop (P-loop) of Mcm2 and the SRF motif of Mcm6, required for ATP hydrolysis by Mcm2 are indicated. K549 is located in the P-loop. (B) ATP hydrolysis by recombinantly expressed Mcm2, Mcm2EE, Mcm2AA and Mcm2K549R in the presence of Mcm6 was measured. The rate of ATP hydrolysis by each pair was calculated and plotted with the standard error of the mean. The rate of hydrolysis by each complex, except between Mcm2/6 and Mcm2AA/6, is significantly different (P < 0.01; n = 3). (C) ATP hydrolysis by Mcm2–7, Mcm2EE–7 and Mcm2KR–7 was measured in triplicate at 1 mM ATP, the rate calculated and plotted with SEM. (D) Haploid strains deleted at mcm2 and containing plasmid-encoded wild-type MCM2, mcm2AA, mcm2EE, mcm2AA,K549R or mcm2EE,K549R were serially diluted 10-fold and then spotted on YPD with the indicated concentrations of caffeine and grown at 30°C.

Similar articles

Cited by

References

    1. Forsburg SL. Eukaryotic MCM proteins: beyond replication initiation. Microbiol. Mol. Biol. Rev. 2004;68:109–131. - PMC - PubMed
    1. Bochman ML, Bell SP, Schwacha A. Subunit organization of Mcm2-7 and the unequal role of active sites in ATP hydrolysis and viability. Mol. Cell. Biol. 2008;28:5865–5873. - PMC - PubMed
    1. Davey MJ, Indiani C, O'Donnell M. Reconstitution of the Mcm2-7p heterohexamer, subunit arrangement, and ATP site architecture. J. Biol. Chem. 2003;278:4491–4499. - PubMed
    1. Schwacha A, Bell SP. Interactions between two catalytically distinct MCM subgroups are essential for coordinated ATP hydrolysis and DNA replication. Mol. Cell. 2001;8:1093–1104. - PubMed
    1. Bochman ML, Schwacha A. The Mcm2-7 Complex has in vitro helicase activity. Mol. Cell. 2008;31:287–293. - PubMed

Publication types

MeSH terms