. 2011 Jul;21(7):1150-9.
doi: 10.1101/gr.115469.110. Epub 2011 May 19.

Unamplified cap analysis of gene expression on a single-molecule sequencer

Affiliations

Unamplified cap analysis of gene expression on a single-molecule sequencer

Mutsumi Kanamori-Katayama et al. Genome Res. 2011 Jul.

Abstract

We report the development of a simplified cap analysis of gene expression (CAGE) protocol adapted for single-molecule sequencers that avoids second strand synthesis, ligation, digestion, and PCR. HeliScopeCAGE directly sequences the 3' end of cap trapped first-strand cDNAs. As with previous versions of CAGE, we better define transcription start sites (TSS) than known models, identify novel regions of transcription and alternative promoters, and find two major classes of TSS signal, sharp peaks and broad regions. However, using this protocol, we observe reproducible evidence of regulation at the much finer level of individual TSS positions. The libraries are quantitative over 5 orders of magnitude and highly reproducible (Pearson's correlation coefficient of 0.987). We have also scaled down the sample requirement to 5 μg of total RNA for a standard HeliScopeCAGE library and 100 ng for a low-quantity version. When the same RNA was run as 5-μg and 100-ng versions, the 100 ng was still able to detect expression for ∼60% of the 13,468 loci detected by a 5-μg library using the same threshold, allowing comparative analysis of even rare cell populations. Testing the protocol for differential gene expression measurements on triplicate HeLa and THP-1 samples, we find that the log fold change compared to Illumina microarray measurements is highly correlated (0.871). In addition, HeliScopeCAGE finds differential expression for thousands more loci including those with probes on the array. Finally, although the majority of tags are 5' associated, we also observe a low level of signal on exons that is useful for defining gene structures.


Figures
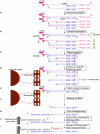
Figure 1.
Figure 1.
HeliScope CAGE protocol workflow. (A) Reverse transcription. cDNA is synthesized using SuperScript III and random N15 primer. (B) Oxidation/biotinylation. The cap structure is oxidized with sodium peroxide and biotinylated with biotin (long arm) hydrazide. (C) RNase I digestion. Single-strand RNA is digested with RNase I. (D) Capture on magnetic streptavidin beads. Biotinylated RNA/cDNA hybrid molecules are captured using magnetic streptavidin beads. (E) Wash unbound molecules. Unbound RNA/DNA hybrid molecules are washed away. (F) Release ss-cDNA. Captured RNA/DNA hybrid molecules are treated with RNase H and RNase I, then heat-treated. (G) Poly(A) tailing/blocking. Released cDNA is poly(A)-tailed using terminal deoxynucleotidyl transferase and dATP, then blocked with biotin-ddATP. (H) Load on flow cell. Blocked poly(A)-tailed cDNA is loaded on the HeliScope flow cell channel and anneals with the dT 50 surface. (I) Fill with dTTP/locked with A/G/C virtual terminator. After annealing of cDNA, the single-strand poly(A) tail part is filled with DNA polymerase, dTTP, and an A/G/C virtual terminator that is used in HeliScope sequencing to lock the poly(T) termini. The library is then ready for sequencing.
Figure 2.
Figure 2.
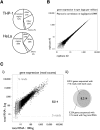
HeliScopeCAGE is a highly quantitative reproducible technology. (A) Average distribution of HeliScopeCAGE tags on annotated regions of the genome for the THP-1 and HeLa libraries. (B) Scatterplot of gene expressions between two technical replicates of HeliScopeCAGE on THP-1 RNA (5 μg of total RNA as starting material). The CAGE tag counts mapped within ±500 bp from the RefSeq transcription starting site are normalized as TPM (tags per million) with the library sizes. (C) (i) Gene expressions between different starting materials, 5 μg and 100 ng of total RNA of THP-1. Scatterplots of the two profiles with read counts. (ii) The number of detected genes with each profile. A gene is considered detected when five or more reads are obtained. Note: Given that mRNA is present at ∼1% of total RNA, A indicates a 300–500-fold enrichment of signal at promoters compared to rRNAs.
Figure 3.
Figure 3.
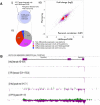
Differential expression using HeliScopeCAGE. (A) Comparison between HeliScopeCAGE and microarray. (i) the number of genes detected in both of THP-1 and HeLa RNA with each platform (detected all of the three technical replicates). (ii) The number of genes detected as differentially expressed. False discovery rate (FDR) <0.001 for HeliScopeCAGE and Bstatistics >0 are used as criteria for the differential expression. (B) Genomic view of a novel Human Endogenous retrovirus (HERV) related transcript highly expressed in THP-1 but not detected in HeLa. (i) and (ii) On linear scale; (iii) and (iv) log scale for HeLa and THP-1, respectively. (Green) Plus strand; (purple) minus strand relative to genome assembly.
Figure 4.
Figure 4.
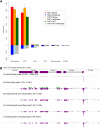
Distribution of HeliScopeCAGE signal within transcription initiation regions. (A) Width distribution of Tag Clusters. CpG and TATA association are shown as blue and red lines, respectively. (B) Fine level TSS preference differences between HeLa and THP-1 in the P2RY6 locus are revealed by HeliScopeCAGE.
Figure 5.
Figure 5.
Sense-antisense HeliScopeCAGE signal. (A) Distribution of CAGE tag signal on the genome relative to 100 bp upstream, 5′ UTR, internal exons, 3′ UTR, and introns in HeliScope CAGE libraries from 5 μg of THP-1, 5 μg of HeLa, and 5 μg of THP-1 when the reverse transcription is carried out in the presence of actinomycin D. (B) Genomic view of the ACTB locus. (i) Linear scale 5 μg of THP-1; (ii) log scale 5 μg of THP-1; (iii–v) log scale 5 μg of THP-1 in the presence of 0.1, 0.2, or 0.4 mg/mL actinomycin D demonstrating sense and antisense painting of exons visually defining the gene boundaries (log scale).

References

    1. Carninci P, Kasukawa T, Katayama S, Gough J, Frith MC, Maeda N, Oyama R, Ravasi T, Lenhard B, Wells C, et al. 2005. The transcriptional landscape of the mammalian genome. Science 309: 1559–1563 - PubMed
    1. Carninci P, Sandelin A, Lenhard B, Katayama S, Shimokawa K, Ponjavic J, Semple CA, Taylor MS, Engstrom PG, Frith MC, et al. 2006. Genome-wide analysis of mammalian promoter architecture and evolution. Nat Genet 38: 626–635 - PubMed
    1. Cloonan N, Forrest AR, Kolle G, Gardiner BB, Faulkner GJ, Brown MK, Taylor DF, Steptoe AL, Wani S, Bethel G, et al. 2008. Stem cell transcriptome profiling via massive-scale mRNA sequencing. Nat Methods 5: 613–619 - PubMed
    1. Core LJ, Waterfall JJ, Lis JT 2008. Nascent RNA sequencing reveals widespread pausing and divergent initiation at human promoters. Science 322: 1845–1848 - PMC - PubMed
    1. Faulkner GJ, Forrest AR, Chalk AM, Schroder K, Hayashizaki Y, Carninci P, Hume DA, Grimmond SM 2008. A rescue strategy for multimapping short sequence tags refines surveys of transcriptional activity by CAGE. Genomics 91: 281–288 - PubMed

Publication types

Substances

Associated data