. 2011 Oct 6;118(14):e101-11.
doi: 10.1182/blood-2011-03-339705. Epub 2011 May 19.

Genome-wide RNA-seq analysis of human and mouse platelet transcriptomes

Affiliations

Genome-wide RNA-seq analysis of human and mouse platelet transcriptomes

Jesse W Rowley et al. Blood. .

Erratum in

  • Blood. 2014 Jun 12;123(24):3843

Abstract

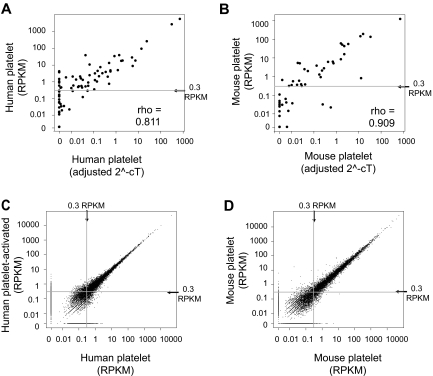
Inbred mice are a useful tool for studying the in vivo functions of platelets. Nonetheless, the mRNA signature of mouse platelets is not known. Here, we use paired-end next-generation RNA sequencing (RNA-seq) to characterize the polyadenylated transcriptomes of human and mouse platelets. We report that RNA-seq provides unprecedented resolution of mRNAs that are expressed across the entire human and mouse genomes. Transcript expression and abundance are often conserved between the 2 species. Several mRNAs, however, are differentially expressed in human and mouse platelets. Moreover, previously described functional disparities between mouse and human platelets are reflected in differences at the transcript level, including protease activated receptor-1, protease activated receptor-3, platelet activating factor receptor, and factor V. This suggests that RNA-seq is a useful tool for predicting differences in platelet function between mice and humans. Our next-generation sequencing analysis provides new insights into the human and murine platelet transcriptomes. The sequencing dataset will be useful in the design of mouse models of hemostasis and a catalyst for discovery of new functions of platelets. Access to the dataset is found in the "Introduction."


Figures

Figure 1
Figure 1
Distribution of sequencing reads in human and mouse platelets. Pie charts represent the number and percentage of sequencing reads from human platelets (top) or mouse platelets (bottom) mapping to indicated genomic regions. Only high-quality alignments following Novoalignment are represented. Although the majority of reads map to known intronic and exonic regions (combined RefSeq, UCSC, and Ensembl annotations), the remaining 1.9% (human) and 2.9% (mouse) of reads map to previously unannotated regions. Novel gene and exon regions are defined as unannotated regions that are enriched, at a conservative threshold, in sequencing reads. All other reads are termed intergenic. Intergenic reads may therefore contain some reads that map to novel genes and exons expressed below the arbitrary threshold.
Figure 2
Figure 2
Abundance (RPKM) measured by RNA-seq in platelets correlates to real-time PCR results and is reproducible between independent platelet isolations. (A-B) Scatter plots comparing RNA-seq–derived RPKM measurements with real-time PCR results from independently isolated platelet preparations from (A) human and (B) mouse. The adjusted 2−Ct value for each gene as measured by real-time PCR are plotted along the x-axis versus the same gene's RPKM on the y-axis. (C-D) Scatter plots demonstrate the within-species correlation of RPKM measurements between independent samples. (C) Human platelet sample split and stimulated with thrombin (y-axis) or left unstimulated (x-axis) before RNA isolation and sequencing. (D) Comparison of RPKM measurements from 2 independent mouse platelet isolations. ρ indicates the Spearman rank correlation coefficient.
Figure 3
Figure 3
Conservation of gene expression levels between human and mouse platelets or between human platelets and PMNs. (A-B) Scatter plots comparing the RPKMs of human platelet genes (x-axis) plotted against the RPKM (y-axis) of the corresponding gene in mouse platelets (A) or in human PMNs (B). Only genes with a human-mouse ortholog are represented. (C-D) The RPKM cutoff used in a Spearman rank correlation analysis (x-axis), plotted against the corresponding value of the ρ correlation coefficient calculated when comparing (C) human and mouse platelets or (D) human platelets and human PMNs. For example, the y-value of the far left point (0 RPKM) represents the ρ correlation coefficient between the RPKMs of all genes expressed in either sample. The y-value of the point at 0.3 RPKM on the x-axis (the vertical line) represents the ρ correlation coefficient calculated for all genes with an RPKM > 0.3 in both samples. The far right point includes only the 20 most highly expressed genes in the calculation of the corresponding correlation coefficient. (E-F) Scatter plots comparing, after removal of all ubiquitously expressed genes, the RPKMs of human platelet genes (x-axis) versus the RPKM of the corresponding gene (y-axis) in mouse platelets (E) or in human PMNs (F). (G-H) After removal of all ubiquitously expressed genes, the RPKM cutoff used in a Spearman rank correlation analysis (x-axis) is plotted against the corresponding value of the ρ correlation coefficient (y-axis) calculated comparing (G) human and mouse platelets or (H) human platelets and human PMNs. All plots shown represent samples isolated via Trizol.
Figure 4
Figure 4
Venn diagram of genes expressed in human versus mouse platelets. Venn diagram represents the overlap in gene expression (> 0.3 RPKM) of all genes with an ortholog match in human versus mouse platelets. The diagram was generated from a combined list of genes expressed in either the Trizol or column isolations. The total numbers of genes expressed with an ortholog match (known orthologs expressed) or, regardless of an ortholog match (RefSeq genes expressed), are given above the diagram.
Figure 5
Figure 5
Representative images of sequencing reads across genes expressed in human or mouse platelets. (A-E) Pictures taken from Integrated Genome Browser of (A) ITGA2B, (B) PAR1, (C) PAR3, (D) PTAFR, and (E) F5 genes expressed in human (left panels) or mouse (right panels) platelets. The height of bars represents the relative accumulated number of 36-bp reads spanning a particular sequence. The number at the top of each plot is the maximum of the y-axis scale for each plot. Gene symbols and RefSeq gene annotations are shown on the bottom of each panel. Thick horizontal lines represent exons; and thin horizontal lines, introns.
Figure 6
Figure 6
CD68 expression in human and mouse platelets. (A) Pictures taken from Integrated Genome Browser of CD68 expression in humans (left panel) or mouse (right panel) platelets. The height of bars represents the relative accumulated number of 36-bp reads spanning a particular sequence. The number at the top of each plot is the maximum of the y-axis scale for each plot. Gene symbols and RefSeq gene annotations are shown on the bottom of each panel. Thick horizontal lines represent exons; and thin horizontal lines, introns. (B) Histograms representing detection of CD68 in human (left panel) platelets or mouse (right panels) platelets or RAW 264.7 macrophages. CD68 or respective isotype controls were detected by intracellular antibody staining followed by analysis on a flow cytometer.

Comment in

References

    1. Jirouskova M, Shet AS, Johnson GJ. A guide to murine platelet structure, function, assays, and genetic alterations. J Thromb Haemost. 2007;5(4):661–669. - PubMed
    1. Tsakiris D, Scudder L, Hodivala-Dilke K, Hynes RO, Coller BS. Hemostasis in the mouse (Mus musculus): a review. Thromb Haemost. 1999;81(2):177–188. - PubMed
    1. Nieswandt B, Aktas B, Moers A, Sachs UJH. Platelets in atherothrombosis: lessons from mouse models. J Thromb Haemost. 2005;3(8):1725–1736. - PubMed
    1. Darrow AL, Fung-Leung WP, Ye RD, et al. Biological consequences of thrombin receptor deficiency in mice. Thromb Haemost. 1996;76(6):860–866. - PubMed
    1. Connolly AJ, Ishihara H, Kahn ML, Farese RV, Coughlin SR. Role of the thrombin receptor in development and evidence for a second receptor. Nature. 1996;381(6582):516–519. - PubMed

Publication types