. 2011 Jul;156(3):1589-602.
doi: 10.1104/pp.111.176016. Epub 2011 May 19.

Leaf rolling controlled by the homeodomain leucine zipper class IV gene Roc5 in rice

Affiliations

Leaf rolling controlled by the homeodomain leucine zipper class IV gene Roc5 in rice

Liang-ping Zou et al. Plant Physiol. 2011 Jul.

Abstract

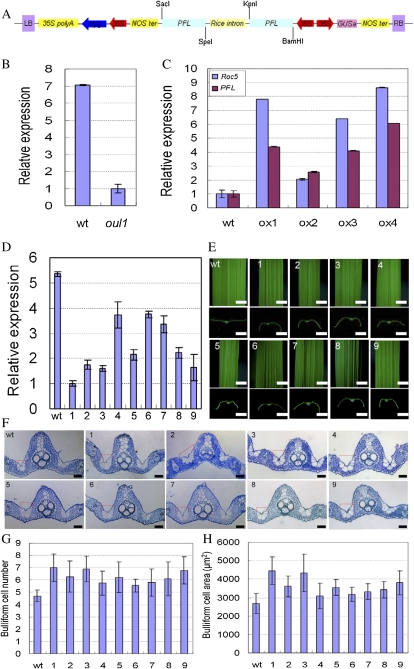
Leaf rolling is considered an important agronomic trait in rice (Oryza sativa) breeding. To understand the molecular mechanism controlling leaf rolling, we screened a rice T-DNA insertion population and isolated the outcurved leaf1 (oul1) mutant showing abaxial leaf rolling. The phenotypes were caused by knockout of Rice outermost cell-specific gene5 (Roc5), an ortholog of the Arabidopsis (Arabidopsis thaliana) homeodomain leucine zipper class IV gene GLABRA2. Interestingly, overexpression of Roc5 led to adaxially rolled leaves, whereas cosuppression of Roc5 resulted in abaxial leaf rolling. Bulliform cell number and size increased in oul1 and Roc5 cosuppression plants but were reduced in Roc5-overexpressing lines. The data indicate that Roc5 negatively regulates bulliform cell fate and development. Gene expression profiling, quantitative polymerase chain reaction, and RNA interference (RNAi) analyses revealed that Protodermal Factor Like (PFL) was probably down-regulated in oul1. The mRNA level of PFL was increased in Roc5-overexpressing lines, and PFL-RNAi transgenic plants exhibit reversely rolling leaves by reason of increases of bulliform cell number and size, indicating that Roc5 may have a conserved function. These are, to our knowledge, the first functional data for a gene encoding a homeodomain leucine zipper class IV transcriptional factor in rice that modulates leaf rolling.


Figures

Figure 1.
Figure 1.
Characterization of oul1 and wild-type (wt) morphology. A and C, At the five-leaf stage, oul1 leaves spiraled slightly in the middle of the leaf blade, whereas wild-type leaves were flat. B and D to F, In mature plants (B), the leaves rolled abaxially to form a cylinder-like shape in oul1 plants compared with the flat wild-type leaves (D–F). ab, Abaxial; ad, adaxial. Bars = 1 cm (A), 10 cm (B), 1 mm (C), and 5 mm (D–F). G and J, The spikelet in oul1 was longer than in the wild type. H and I, LRIs (H) and LEIs (I) of the wild type and oul1 are shown. K and L, The spikelet number per panicle (plump + empty) in oul1 (n = 136) was higher than in the wild type (n = 106; K), whereas oul1 had a lower (66%) seed-setting rate than the wild type (88%; L).
Figure 2.
Figure 2.
oul1 has increased bulliform cell number and size. A and B, Adaxial epidermal peels abutting the small veins of the wild type (wt; A) and oul1 (B). C to F, Cross sections of wild-type (C) and oul1 (D) mature leaf blades show significantly increased oul1 bulliform cell number (E) and area (F) between vascular bundle ridges. ab, Abaxial; ad, adaxial. Red lines (C and D) show the bulliform cells. Data show means and sd values of biological replicates (n > 23) and statistical analysis by heteroscedastic t test indicating significant differences (** P < 0.01). Bars = 20 μm (A–D). G, Relative water content of the 10th leaf of 120-d-old greenhouse plants grown in the soil. oul1 had higher water content than the wild type. The data are means and sd (n > 5), with statistical analysis using the heteroscedastic t test showing significant differences (** P < 0.01).
Figure 3.
Figure 3.
Leaf rolling in oul1 is due to increased number and size of bulliform cells. A to L, Cross sections of the first leaves of 3-d (A and B), 5-d (C and D; folded leaves), and 8-d (E and F; unfolded leaves) seedlings and second (14 d; G and H), third (22 d; I and J), and fourth (32 d; K and L) leaves of wild-type (wt) and oul1 plants. Red arrowheads (C and D) and lines (E–L) indicate bulliform cells. In the first leaf, bulliform cells were undifferentiated at 3 d (A and B) and were evident in the folded leaf of 5-d-old seedlings (C and D), but bulliform cell number increased in oul1 compared with the wild type in the 8-d-old unfolded leaf, although the leaves of oul1 were flat (E and F). Bulliform cell number also increased in first unfolded (E and F), second (G and H), third (I and J), and fourth (K and L) leaves of oul1 compared with the wild type. Bars = 20 μm. M, Bulliform cell area between vascular ridges from the first folded leaf to the fourth leaf stage shows a higher increasing trend in oul1 than in the wild type. Data show means and sd of biological replicates (n > 23). N, qRT-PCR analysis of Roc5 expression in different developing leaves. Data show means and sd (n = 3).
Figure 4.
Figure 4.
Roc5 characterization and nuclear localization of Roc5 in onion epidermal cells. A, Schematic representation of the T-DNA insertion into the sixth intron of Roc5 (exons = black boxes; introns = white boxes) and Roc5 protein domain organization (http://www.uniprot.org/uniprot/Q6EPF0). L and R represent the left and right T-DNA borders, respectively. Arrows indicate the primers used for genotyping with AS39/LB2/S39 and with Q1f and Q1r. UTR, Untranslated region. B, RT-PCR analyses of Roc5 expression in the wild type (wt) and oul1, using ACTIN as a control. One RT-PCR primer for Roc5 spans the sixth intron, and genomic DNA (gDNA) served as a negative control. C to H, 35S::Roc5-GFP (C–E) and 35S::GFP (F–H) constructs were transiently expressed in onion epidermal cells, showing bright-field (C and F), GFP (D and G), and merged (E and H) signals.
Figure 5.
Figure 5.
Complemented expression of Roc5 rescues the mutant phenotypes of oul1. A, qRT-PCR analyses of Roc5 expression in the wild type (wt), oul1, and independent complementation plant 1 (cp1) and cp2, showing the expression of cp1 and cp2 near the wild-type level. Experiments are biological replicates with sd. B, Comparison of the wild type, oul1, and the complementation lines shows that Roc5 could rescue the leaf-rolling phenotype in oul1. ab, Abaxial; ad, adaxial. Bars = 10 cm (top) and 5 mm (middle and bottom). C to J, Toluidine blue O-stained adaxial epidermal peels abutting large (C–F) or small (G–J) veins of the wild type (C and G), oul1 (D and H), and cp1 and cp2 (E, F, I, and J). K to N, Cross sections of the wild type, oul1, and complementation lines show similar bulliform cell morphology in complementation plants (M and N) and the wild type (K). Line segments (red) highlight the bulliform cells. Bars = 20 μm (C–N). O to Q, LRIs of the second leaf from the top at flowering time (O), and the number (P) and area (Q) of bulliform cells in mature leaf blades for the wild type, cp1, and cp2.
Figure 6.
Figure 6.
Enhanced or suppressed expression of Roc5 leads to adaxially or abaxially rolled leaves, respectively. A, qRT-PCR analysis of Roc5 expression shows that the two independent overexpression lines (ox1 and ox2) had higher expression levels than the wild type (wt), whereas cosuppression (cs1 and cs2) transcripts were lower than the wild type, with the expression of cs2 near the oul1 level. B, Morphological phenotypes of wild-type, oul1, ox1, ox2, cs1, and cs2 plants show that the leaves of overexpression lines were adaxially rolled and cosuppression lines were abaxially rolled, whereas those of the wild type were flat. ab, Abaxial; ad, adaxial. Bars = 10 cm (top) and 5 mm (middle and bottom). C to N, Toluidine blue O-stained adaxial epidermal peels abutting large (C–H) or small (I–N) veins of the wild type (C and I) and oul1, ox1, ox2, cs1, and cs2 (D–H and J–N) showing purple-stained bulliform cells. O to T, Cross sections of leaves show that, compared with the wild type (O), bulliform cells in ox1 (Q) and ox2 (R) were smaller, whereas those in cs1 (S) and cs2 (T) plants were larger, with cs2 (T) similar to oul1 (P). Red lines highlight the bulliform cells. Bars = 20 μm (C–T). U and V, Measurement of numbers (U) and area (V) of bulliform cells in the wild type, ox1, ox2, cs1, and cs2. Data show means of biological replicates with sd (n > 30).
Figure 7.
Figure 7.
Construction of 35S::PFL-RNAi and characterization of transgenic plants. A, Schematic structure of 35S::PFL-RNAi vector includes the inverted repeat sequence of the 3′ end regions of PFL DNA. LB, Left border; Hyg, hygromycin; NOS ter, A. tumefaciens nopaline synthase terminator; RB, right border. B to D, qRT-PCR analyses of PFL (B and D) and Roc5 (C) expression show that, compared with the wild type (wt), PFL expression was decreased in oul1 (B), increased in overexpression (ox) lines, similar to Roc5 (C), and decreased in nine independent T0 PFL-RNAi transgenic plants from which total leaf RNA was analyzed (D). E and F, Morphological phenotypes (E) and cross sections (F) of the flat wild-type and abaxially rolled PFL-RNAi leaves show varying increases in bulliform cell size (F; highlighted by red lines). Bars = 5 mm (E) and 20 μm (F). G and H, Measurement of number (G) and area (H) of bulliform cells in wild-type and PFL-RNAi lines. Graphs show means of biological replicates and sd (n > 30).

References

    1. Abe M, Katsumata H, Komeda Y, Takahashi T. (2003) Regulation of shoot epidermal cell differentiation by a pair of homeodomain proteins in Arabidopsis. Development 130: 635–643 - PubMed
    1. Abe M, Takahashi T, Komeda Y. (2001) Identification of a cis-regulatory element for L1 layer-specific gene expression, which is targeted by an L1-specific homeodomain protein. Plant J 26: 487–494 - PubMed
    1. Barrs HD, Weatherley PE. (1962) A re-examination of the relative turgidity technique for estimating water deficits in leaves. J Biol Sci 15: 415–428
    1. Becraft PW, Li K, Dey N, Asuncion-Crabb Y. (2002) The maize dek1 gene functions in embryonic pattern formation and cell fate specification. Development 129: 5217–5225 - PubMed
    1. Bolstad BM, Irizarry RA, Astrand M, Speed TP. (2003) A comparison of normalization methods for high density oligonucleotide array data based on variance and bias. Bioinformatics 19: 185–193 - PubMed

Publication types

MeSH terms

Associated data

LinkOut - more resources