. 2011 Sep;129(2):607-16.
doi: 10.1007/s10549-011-1564-5. Epub 2011 May 20.

Biologic markers determine both the risk and the timing of recurrence in breast cancer

Affiliations

Biologic markers determine both the risk and the timing of recurrence in breast cancer

Laura J Esserman et al. Breast Cancer Res Treat. 2011 Sep.

Abstract

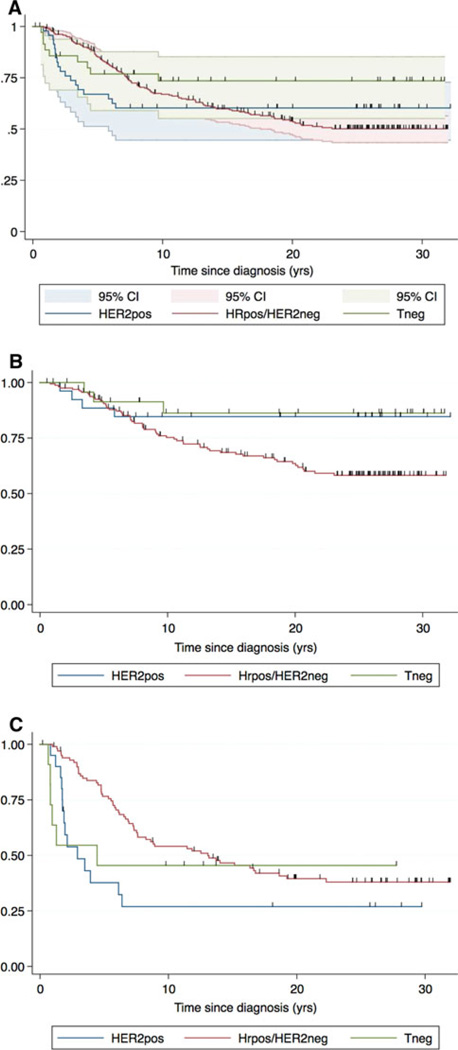
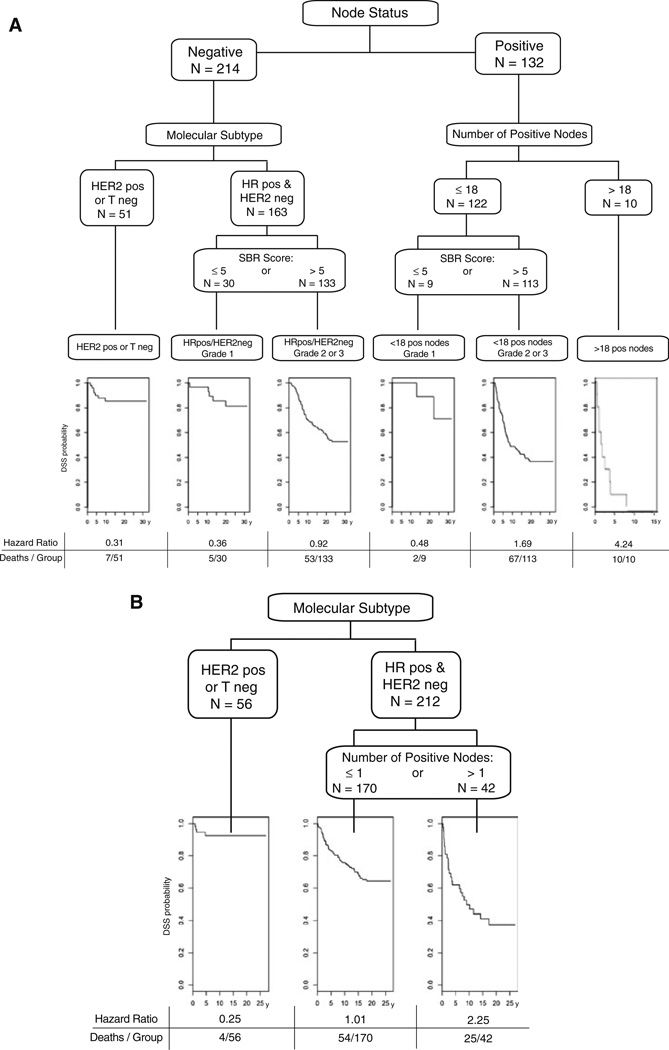
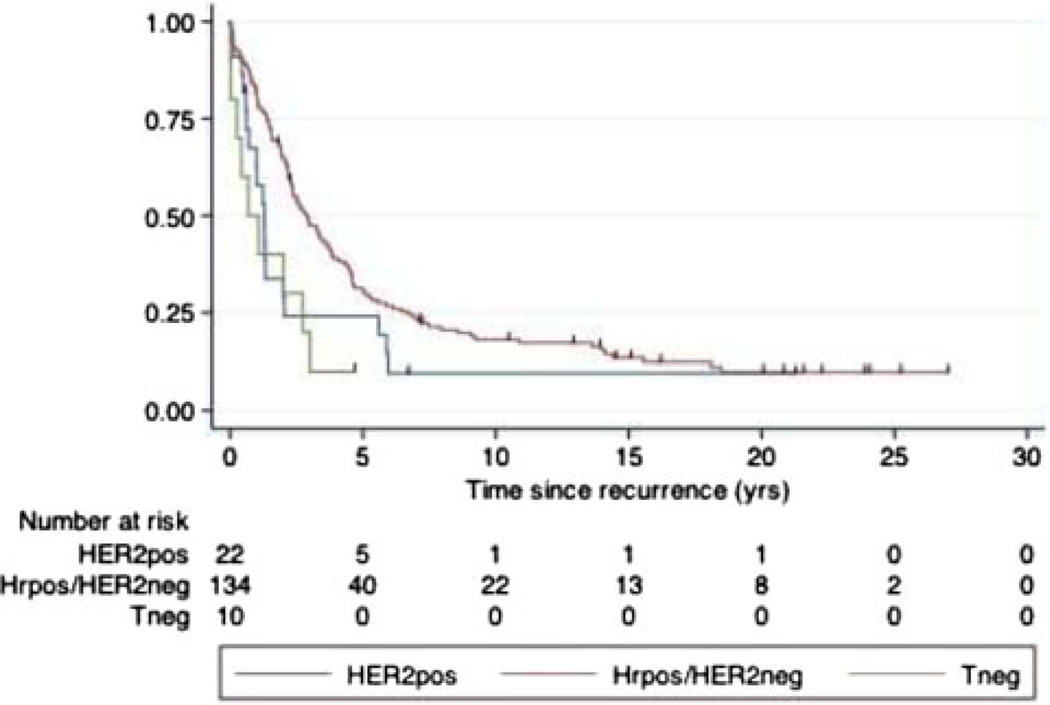
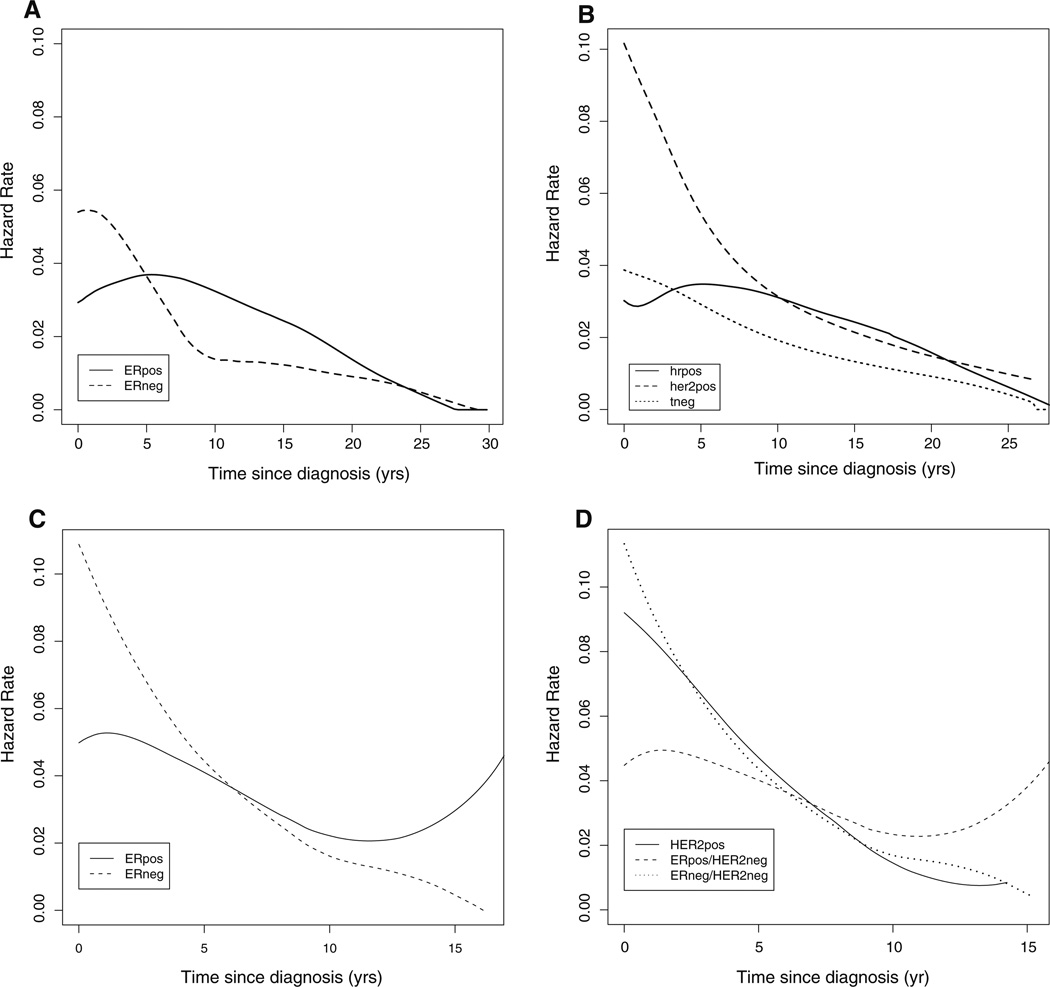
Breast cancer has a long natural history. Established and emerging biologic markers address overall risk but not necessarily timing of recurrence. 346 adjuvant naïve breast cancer cases from Guy's Hospital with 23 years minimum follow-up and archival blocks were recut and reassessed for hormone-receptors (HR), HER2-receptor and grade. Disease-specific survival (DSS) was analyzed by recursive partitioning. To validate insights from this analysis, gene-signatures (proliferative and HR-negative) were evaluated for their ability to predict early versus late metastatic risk in 683 node-negative, adjuvant naïve breast cancers annotated with expression microarray data. Risk partitioning showed that adjuvant naïve node-negative outcome risk was primarily partitioned by tumor receptor status and grade but not tumor size. HR-positive and HER2-negative (HRpos) risk was partitioned by tumor grade; low grade cases have very low early risk but a 20% fall-off in DSS 10 or more years after diagnosis. Higher grade HRpos cases have risk over >20 years. Triple-negative (Tneg) and HER2-positive (HER2pos) cases DSS events occurred primarily within the first 5 years. Among node-positive cases, only low grade conferred late risk, suggesting that proliferative gene signatures that identify proliferation would be important for predicting early but not late recurrence. Using pooled data from four publicly available data sets for node-negative tumors annotated with gene expression and outcome data, we evaluated four prognostic gene signatures: two proliferation-based and two immune function-based. Tumor proliferative capacity predicted early but not late metastatic risk for HRpos cases. The immune function or HRneg specific signatures predicted only early metastatic risk in Tneg and HER2pos cases. Breast cancer prognostic signatures need to inform both risk and timing of metastatic events and may best be applied within subsets. Current signatures predict for outcome risk within 5 years of diagnosis. Predictors of late risk for HR positive disease are needed.


Conflict of interest statement

Conflicts of interest None of the authors declared any conflict of interest.

Figures

Fig. 1
Fig. 1
Kaplan–Meier plots for Guy’s Hospital dataset. Kaplan–Meier analyses of recurrence-free survival were developed for 346 Guy’s Hospital patients based on stage (tumor size and nodal status), ER, PR, and HER2 status, age, and grade. Plots for the entire dataset (a), node-negative patients only (b), and node-positive patients only (c) are shown. In each figure, curves are plotted for a trichotomy of classic tumor subtypes: Tneg, HER2pos, and HRpos/HER2neg. For all molecular subsets, Kaplan–Meier plots show an asymptote, suggesting a mixed population of patients with many cured by surgery alone. There were only 20 IHC 2+ cases, and using DAKO A0485, the likelihood of FISH positivity with 2+ IHC staining is 20% [39], thus very few cases (<4) would likely be reclassified
Fig. 2
Fig. 2
a Results from rpart analysis of Guy’s Hospital dataset for DMFS at diagnosis. Recursive partitioning of patients into subgroups by the R program rpart is shown. The rectangular labels show the factors that drive the splitting of the population in the order of impact. The first split is on node status. For node-negative cases the next split is based on molecular subtype: HER2pos or Tneg versus HRpos/HER2neg. The HRpos/HER2neg are then split by SBR grade ≤5 or >5. For node-positive cases, the first split is for the number of positive nodes (≤18 vs. >18) and for those with ≤18 positive nodes, they are split by SBR Grade ≤5 or >5. The hazard ratio gives the relative risk of dying from breast cancer for that arm of the tree compared to the whole population. For example, the left-uppermost number is 0.31. This means that patients who are node-negative who are HER pos or Tneg are dying from breast cancer at a rate that is 0.31 that of patients in the whole population. The bottom sets of numbers are the number of patients who died from breast cancer within each subgroup and the total number in that subgroup. For the HER2pos or Tneg subgroup, for example, 7 out of 51 died from breast cancer. The DSS curves shown below the final subgroups reflect the timing of the deaths. b Survival time among 5 year survivors. Recursive partitioning of patients who survived 5 years without death by breast cancer by the R program rpart is shown. Trigroup is now the biggest predictor of DSS. In the HRpos group, number of positive nodes (≤1 or >1) determined the splitting pattern. The corresponding Kaplan–Meier curves and hazard ratios are shown below. Note that time = 0 years on the DSS curves is 5 years post-diagnosis
Fig. 3
Fig. 3
DSS following recurrence. 142 of the 144 patients who died of breast cancer in the Guy’s dataset have dates of recurrence. The survival following the date of recurrence is shown. For HRpos/HER2neg median survival following a recurrence is 2.9 years (95% CI 2.3–3.7) while for Tneg or HER2pos it is 1.2 years (95% CI 0.6–2.0), P = 0.003. Nearly everyone who recurred eventually died of their disease. The last disease-specific death for HER2 pos, Tneg and HR pos is at 5.9 years, 3 years, and 18.5 years, respectively
Fig. 4
Fig. 4
Hazard plots for disease-specific survival by receptor status classification from Guy’s Hospital. a Hazard functions based on HR positivity in the Guy’s dataset are shown. b Hazard functions for HER2pos, HRpos/HER2neg, and Tneg (“trigroup”) patients in the Guy’s dataset are shown. Hazard for the HRpos/HER2neg subgroup declines after peaking at approximately 6 years after diagnosis in contrast to Tneg and HER2pos patients, where hazard declines in the first 5–7 years after diagnosis

Similar articles

Cited by

References

    1. Sorlie T, Perou CM, Tibshirani R, et al. Gene expression patterns of breast carcinomas distinguish tumor subclasses with clinical implications. Proc Natl Acad Sci USA. 2001 Sep 11;98(19):10869–10874. - PMC - PubMed
    1. van‘t Veer LJ, Dai H, van de Vijver MJ, et al. Gene expression profiling predicts clinical outcome of breast cancer. Nature. 2002 Jan 31;415(6871):530–536. - PubMed
    1. Hu Z, Fan C, Oh DS, et al. The molecular portraits of breast tumors are conserved across microarray platforms. BMC Genomics. 2006;7:96. - PMC - PubMed
    1. Ross JS, Hatzis C, Symmans WF, Pusztai L, Hortobagyi GN. Commercialized multigene predictors of clinical outcome for breast cancer. Oncologist. 2008;13(5):477–493. - PubMed
    1. Pusztai L. Gene expression profiling of breast cancer. Breast Cancer Res. 2009;11(Suppl 3):S11. - PMC - PubMed

Publication types

MeSH terms